Some notes on Tycho
photometry and its use
Section Director's
Note
This item was contributed by Mark Kidger and
he points out that this is unpublished research and therefore copyright and
requests that anyone wishing to use the information quotes the source and
requests permission prior to publication.
1.0 What is Tycho photometry?
Tycho was an instrument on the Hipparcos
satellite launched in 1989. Tycho was a scanning star-mapper that was less
precise than main instrument – although still extremely precise compared to
most ground-based measurements – but that allowed somewhat fainter stars to be
measured in two colours, roughly approximating to the B and V bands. The
Tycho-2 catalogue, the most recent and definitive, includes 2 539 913 stars
(about 60 per square degree of sky) and is almost complete to magnitude V=11.
Although typically an individual Tycho
measurement had rather large errors, Tycho took many tens of measures – on
average one hundred and thirty – thus the uncertainty in the final Tycho
magnitude is normally about a factor of ten better than the standard deviation
of the measures for any star.
Note that only the Tycho-2 catalogue should be
used. Previous Tycho photometry suffered from some difficulties, as is logical in
such a vast undertaking and these have had to be ironed-out progressively with
time.
2.0 The problem
Although Tycho photometry is stated to be “rather close”
to the Johnson system, even the most cursory use of the data shows that,
especially in B, there are large differences between the Johnson system and
Tycho-2 magnitudes. Despite the fact that Tycho-2 magnitudes are listed to
three places of decimals, that is, millimagnitude precision, the difference
between the Tycho-2 magnitude and Johnson-scale photometry can be more than 0.5
magnitudes in B and 0.2 magnitudes in V. This effect means that uncorrected
Tycho-2 photometry may be highly misleading. However, the exact correction to
apply has been subject to considerable discussion.
My student, Fabiola Martín-Luis and I are using
Tycho photometry in a calibration programme to make a precise calibration of
stars for the 10-m Gran Telescopio CANARIAS (GTC). This programme has required
us to compile accurate visible and near-infrared photometry for a large number
of stars, both from our own observations at Teide Observatory (
This programme has required us to understand
Tycho photometry and its relationship to the standard photometric systems. We
have compared Tycho-2 photometry with observations of some 500 stars observed
in BVRI on multiple nights at the two observatories using the 1-m Jacobus
Kapteyn Telescope (JKT) and the 0.82-m IAC-80 Telescope (IAC-80). All our
observations were calibrated against Landolt stars, the accepted standard for
visible photometric calibration. On a typical night we observed some sixty
Landolt stars of a wide range of colours to calibrate our photometry.
We have previously established that our
photometry is very close indeed to the standard Johnson system of photometry.
We call our photometric system (purely for internal use), the Johnson-FML
system that, here, is abbreviated to “FML” (or, on the axes of some plots, to
“FM”).
The results of our study are presented
below.
When we represent uncorrected Tycho-2
photometry against FML photometry we see two important effects: first, the
slope of the line is clearly less than unity, in other words, Tycho magnitudes
are consistently fainter than FML photometry; second, there is an evidence
increase in the photometric dispersion to fainter magnitudes.
These two tendencies are clearly seen in both
bands, although they are especially strong in B. Note too how, at B>8, the
stars seem to separate into two bands in the plot, with the upper band
appearing to follow the line of BTycho = BFML and the
second band of Stars showing BTycho > BFML.
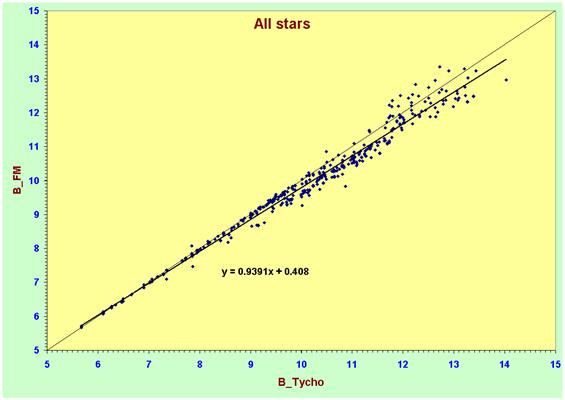
By B=13 the
least squares fit to the photometry shows that BTycho » BFML + 0.7, so the differences are
very important.
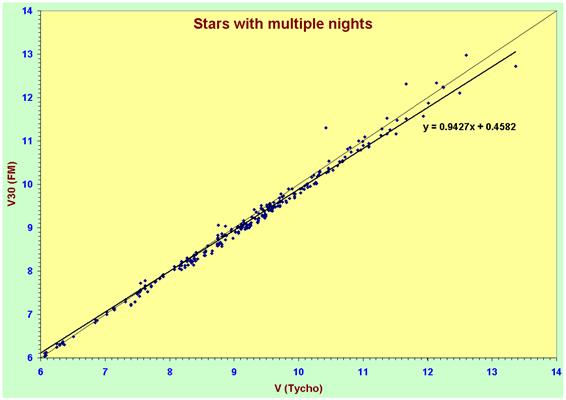
A similar effect is seen in V, although the
trend is not so marked. Note how, for the brightest stars, it appears that VTycho
= VFML, just as, in B, for the brightest stars we see that BTycho
= BFML. This effect is extremely misleading and, as we will see, is
due to the fact that our bright stars are, for instrumental reasons, all of
spectral type A[1]. Note that in the plot
below “V30” refers to the filter number in the JKT database. This allows us to
identify the filter’s exact profile and chacteristics as several V filters with
slightly different transmission profiles were available to users. We used this
same filter in each observing run.
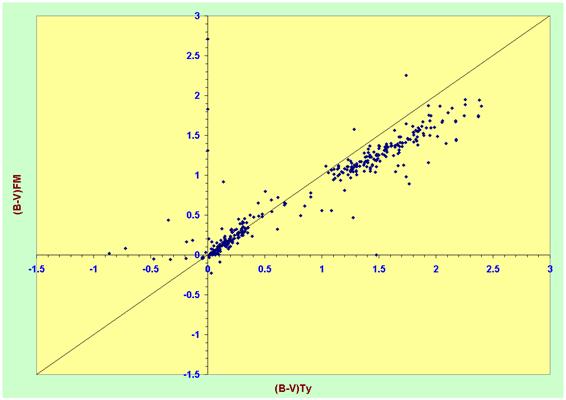
The plot of
(B-V)FML against (B-V)Tycho gives us some valuable hints about
Tycho’s photometric behaviour, as well as the biases in our sample of stars,
which can give rise to misleading results in this, or any other study. It also
shows that a few stars have wildly inaccurate photometry: this can be due to
misidentification of the star when cross-correlating between our star list and
the Tycho catalogue, or to problems with the photometry (usually with the
faintest stars observed by Tycho). Note how our sample of stars splits into two
well-separated groups in the colour-colour plot. One group shows (B-V) £ 0.35 and the second, (B-V) ³ 1.0. This separation is logical as
the stars that we have selected for calibration are mainly of spectral types
A(0-5)V and K-MIII; these groupings of colour indices reflect the normal
colours for stars of these spectral types, the former white or slightly yellow,
the latter orange or red.
Note also that the stars with a colour index
close to zero are the ones that show (B-V)FML = (B-V)Tycho,
while the red stars show (B-V)FML >> (B-V)Tycho.
This demonstrates that there is a strong colour term in the photometry.
3.0 Questions and solutions
3.1 Question 1
Is Tycho photometry on the same photometric
scale as Johnson-FML, or is there a slope and/or zero point correction required
to transform Tycho photometry to the Johnson system?
We need to solve the equation
VFML = a * VTycho + b +
c* (B-V)
(1)
And demonstrate that a = 1 and that b = 0.
3.2 Solution
We selected a simple of stars with a colour
index of zero and looked at the trend on the magnitude-magnitude diagram,
comparing Tycho-2 photometry with FML. The stars selected all had a colour
index in the range –0.05 £ (B-V)FML £ +0.10.
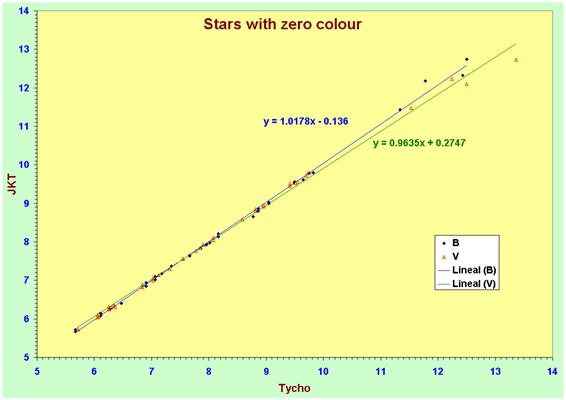
Note that to magnitude 10 Tycho º Johnson-FML. At fainter magnitudes the Tycho
photometry can have very large errors, leading to significant dispersion. The
presence of a few faint stars with large photometric errors means that the
least squares fit has a slope that is not exactly unity, but it is evident that
it is extremely close to unity and that the brighter stars are tightly
clustered around a line of slope unity.
When the fainter stars are neglected in the
fit, the least squares regression fit has a slope of unity that, within the
errors, passes through the origin. In other words, we can state with a high
degree of confidence that, in equation (1), a = 1 and b = 0 and that we can
treat the correction of Tycho-2 photometry as requiring only a colour
transformation to place it on the standard Johnson photometric system.
3.3 Question 2
What is the colour transformation required to
convert Tycho-2 photometry to the Johnson system and how should it be applied?
We can now simplify equation (1) to
VML = VTycho + c* (B-V)
Calculate the value of “c” and ensure that it
is a simple linear term.
3.4 Solution
This we do in two steps. First, we select a
sample of stars with the same magnitude and look at the correction between the
difference in magnitude Tycho-FML and the colour index. The selected stars had
magnitudes from 8.9 < V <. 9.1, giving more than 40 stars,
all with good photometry and a range of colour index up to (B-V) = +2.2.

In both B and V we can see that the Tycho-FML
difference is strongly correlated with the colour index. The dependence is much
stronger between (B-V)Tycho and BTycho-BFML
with the steeper slope typical of a detector with low blue sensitivity[2]
and also shows greater dispersion because the reddest stars are very faint for
Tycho to observe in B and thus have large photometric errors. In contrast, V
shows a smaller dispersion, but also weaker colour correlation. Note that in
neither case does the least squares fit pass through the origin.
We find that:
VFML = VTycho - 0.032 - 0.0833 * (B-V)Tycho
And
BFML = BTycho + 0.056 - 0.3006 * (B-V)Tycho
When we make the same plot with the full data
set we find almost identical fits to the data but, logically, as some of the
stars are rather faint, a much greater dispersion and a population of outliers.
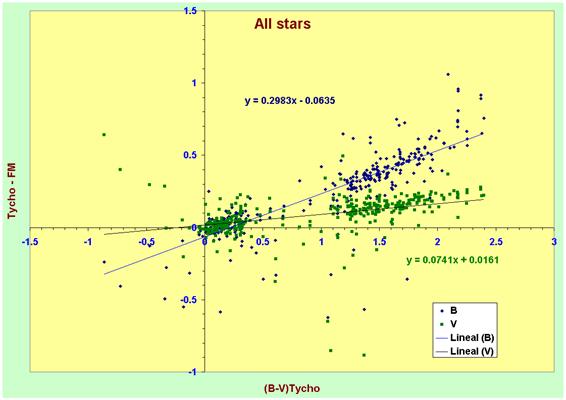
For the full simple of stars we find fits that
are virtually identical to the reduced, magnitude-limited sample:
VFML = VTycho - 0.016 - 0.0741 * (B-V)Tycho
And
BFML = BTycho + 0.064 - 0.2983 * (B-V)Tycho
These two relations are our definitive
transformations for the Tycho photometry.
The fact that the regression lines of both the
magnitude-limited and complete sample of stars are – to within the errors –
identical, also serves as a check that the transformation from Tycho to
Johnson-FML depends only on the colour index and not on the magnitude of the
star.
Now we invert the process and apply to derived
colour correction to the Tycho photometry to check that it corrects both the
dispersion and the slope of the magnitude-magnitude diagram.
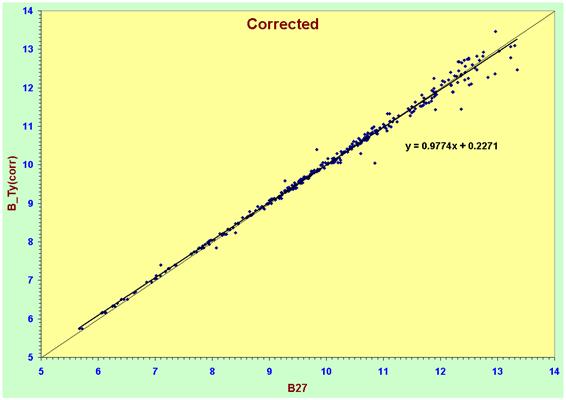
In B the change in the plot before and after
correction is considerable. We see that the regression line slope in the
corrected plot is close to unity and that the dispersion is small to B=12.
Unfortunately though, as can be seen, the presence of some much fainter stars
with a large dispersion skews the fit slightly and makes it flatter than unity.
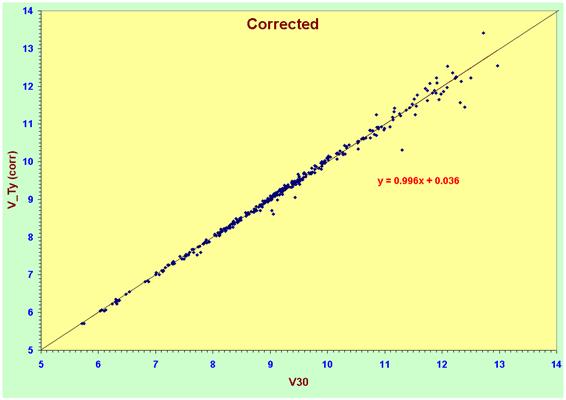
In V the improvement to the fit is even greater
and the slope differs from unity by less than 0.5%. This relationship is seen
to describe the magnitude accurately in the range from 5 < V < 12.5 with
an acceptable dispersion.
4.0 Conclusions
- Tycho-2,
as published, is not corrected for colour transformation.
- When
corrected, it is in the standard Johnson system.
- The
colour term is large and is especially important in B, but should not be
neglected in V.
- There
is a simple correction so transform Tycho ® Johnson.
VFML = VTycho - 0.016 - 0.0741 * (B-V)Tycho
Ø
And
BFML = BTycho + 0.064 - 0.2983 * (B-V)Tycho
- However,
this correction depends on (B-V)Tycho colour index and thus is
a hostage to its reliability. For the fainter and redder stars where the
error is (B-V)Tycho is large there will be a correspondingly
large error in the transformation of the magnitude to the Johnson scale.
In extreme cases, for fainter and redder stars, the total uncertainty in
the transformed magnitude may be >0.3 magnitudes.