This Jupiter Section Programme
was published in the Journal of the BAA:
Rogers
J H, J. Brit. Astron. Assoc. 114,
88-94 (2004 April).
'The Jupiter Section programme in the new century.'
The Jupiter Section membership consists of (i) all observers contributing observations within the last two years; (ii) other BAA members on the mailing list for Section Circulars (see below).
The Section aims (i) to encourage people to observe Jupiter, and to provide advice on doing so; (ii) to monitor the visible changes in the atmosphere of the planet, and to produce scientifically valuable reports on these changes.
Everything seen on Jupiter is clouds, and our aims are to monitor the currents, colours, and disturbances in the planet's atmosphere. The BAA has been doing this systematically since 1891, and the published Section Reports comprise an incomparable record of changes on the planet. Our observations are still revealing new patterns and new variations. Changes occur on many timescales. The overall pattern of dark belts and bright zones is permanent but can change temporarily, for a matter of years or months. Sometimes there are striking colour changes too. There are many 'spots' - circulations and storms, which reveal the numerous currents in the atmosphere. They range from the Great Red Spot, which has existed for three centuries, to turbulent disturbances which may change dramatically within a few days. (Full details of the planet are described in Ref.3.) The standard nomenclature of belts and zones and currents has been refined [Refs.3,4], since the Voyager spacecraft discovered how these visible features are bounded by a regular pattern of jetstreams in fixed latitudes
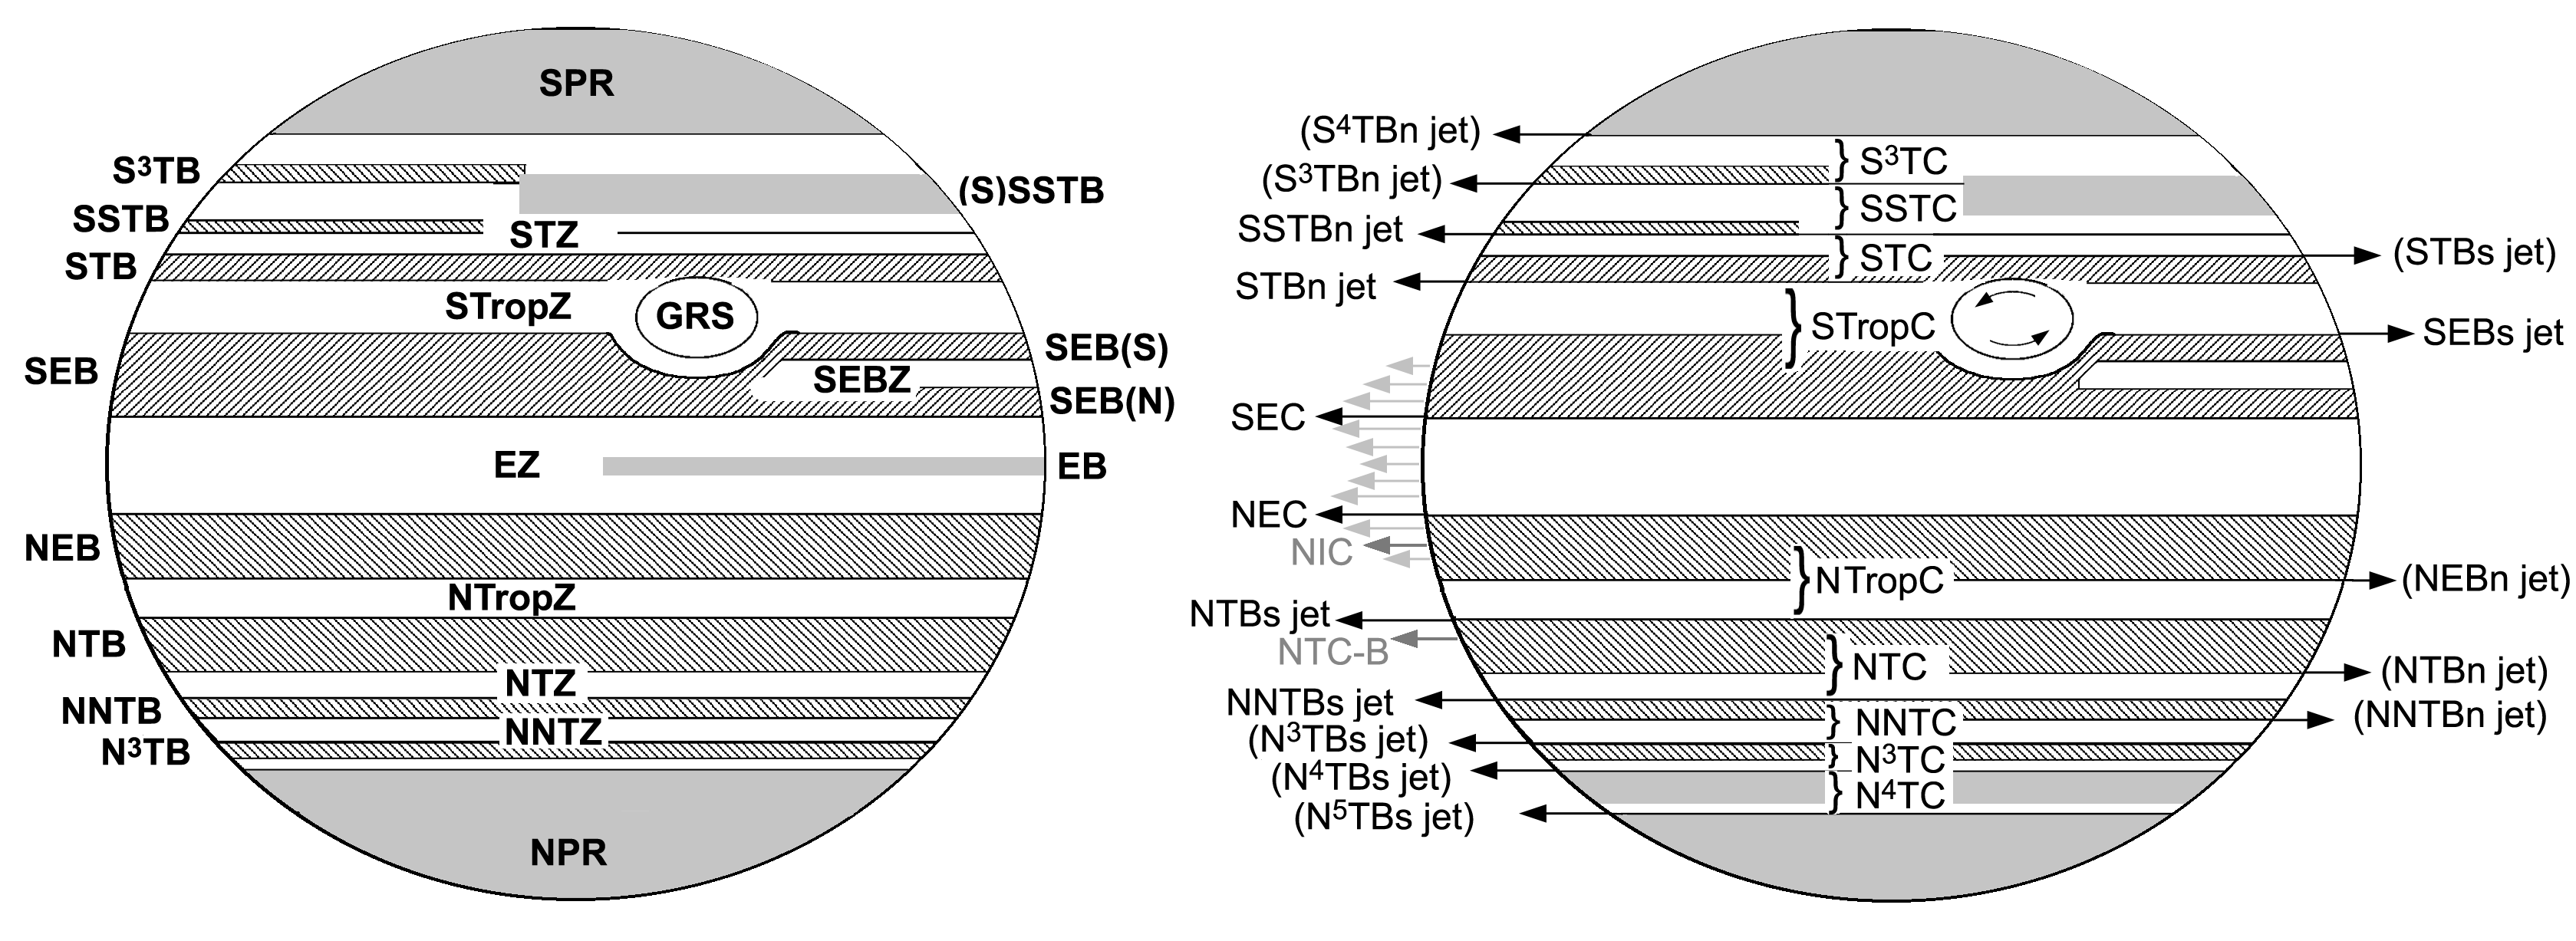
(Figure 1, click on the image for a bigger view in a new window (194kb)).
Standard nomenclature for the belts, zones, and currents of
Jupiter's atmosphere (redrawn from: Rogers JH, 'The Giant Planet Jupiter',
Cambridge University Press, 1995). South is up.
Left: Standard abbreviations for belts and zones. On the right side are examples
of belts commonly observed that are not part of the standard dynamical framework
of the atmosphere.
Right: Names of the prograding jet streams (left side), retrograding jetstreams
(right side), and slow currents (centre). (Jetstreams in brackets are rarely or
never observed from Earth.) Slow currents govern the motions of most spots
observed from Earth (except those in the equatorial region), and each slow
current applies within a domain of latitude bounded by prograding jetstreams.
This diagram shows the exact latitudes of the jetstreams, which normally form
the boundaries of the belts, so it can be used as a model for drawing, although
observers should be alert for deviations from the standard pattern. Drawings
should have disks 60 x 64 mm.
Although our reports are now based mainly on CCD images, visual observers still have a chance of spotting new phenomena. In addition, visual observers can monitor the major events on the planet independently, and we will continue to publish visual records of the planet along with the analysis of images.
We have reviewed our conventions, as they differ from the conventions adopted more recently by professional astronomers, and we will adopt the following in future:
--Longitudes (in Systems I or II) will be abbreviated as L1, L2 (rather than lambda-suffix-1,2, as in the past). Central meridian longitudes will be abbreviated as CM1, CM2 (rather than omega-suffix-1,2). This change is to make our reports compatible with e-mail.
--We will continue to use longitude System II for non-equatorial latitudes, rather than System III which is used by professionals. The reasons are: (i) All historical observations have been in System II. (ii) The Great Red Spot, and major features associated with it in the SEB, are almost stationary in System II, so it is easy to point observers to them by L2. However we will give data for conversion to System III in all reports, and we ask imagers to report CM longitudes in all three systems (CM1, CM2, CM3).
--We will continue to publish images and drawings with south up, for two reasons: (i) This is how visual observers (in the northern hemisphere) see the planet, and we want to maintain the link between our reports and the direct experience of observers. (ii) With this orientation, both longitude and time increase from left to right, allowing a natural integration of numbering systems, cylindrical projection maps, and longitude/time charts.
We encourage visual observations both by beginners and by more experienced observers. While major features such as belts and equatorial dark projections can be seen with an 8-cm telescope, satisfactory observations require a telescope of aperture at least 15 cm (6 inches). Beginners should try the following methods of observation, so that they can make useful records if they ever see anything unexpected on the planet. For more detailed advice, please see the BAA observing guide [ref.5] or the Director's book [ref.3]. More advanced observers may wish to specialise as suggested.
(1) Drawings. Most people like to draw what they see, and this is a skill that takes some practice to develop. Good drawings are worthwhile as illustrations of the general appearance of the planet, and may sometimes be useful as records of special events. Before starting a drawing, inspect the planet carefully. Then make a quick outline sketch so that the features are positioned at a single time, then fill in the fine details. It is important to draw everything you see: consciously examine the latitudes, widths and intensities of the belts and zones. One common error is to draw them too far apart, so that the periphery of the disk (where features are obscured by limb darkening) is compressed. The standard size for a disk drawing is 64 by 60mm.
A more advanced option is to develop one's style of drawing (or even colour painting) so as to combine observational accuracy with artistic quality. Another option is to make strip-maps (cylindrical projection maps) of part or all of the planet. A practised observer can do this at the telescope, over several hours of observation, adding to the map continuously as the planet rotates, with accompanying transit timings to measure longitudes. Afterwards, longitude scales can be added. Alternatively, a set of drawings (not more than a few days apart) can be transformed into a global map, one or more times during an apparition. Features at high latitudes must be artificially elongated to fit this type of projection.
(2) Longitude measurements. Useful longitude measurements of spots can be made by timing their 'transits'. This does not require any special equipment: one just estimates the time at which the spot crosses the centre-line of the disc (the central meridian). The observer should give the transit time to the nearest minute (which corresponds to 0.6 deg. of rotation in longitude), and calculate L1 or L2 from the tables in the BAA Handbook. Any observer who sees an unexpected, possibly novel feature on the planet is urged to make a transit timing.
An advanced observer might wish to make transits systematically through an apparition, accompanying them with sketches, as has been done by the Jupiter Section in the past. If transits are accurate and numerous enough (so that the observer's personal equation can be established), the observer could plot his/her own charts to follow spots on their different currents over several months, and these data could be used as a supplement to image-based analysis. Observers doing systematic transit timings are urged to type in their results in JUPOS format, so that they can be put into the JUPOS database and plotted on the charts. For the format, see the web site [Ref.6].
(3) Colour and intensity estimates. Systematic verbal estimates of colours of belts and zones may be useful, if made with a reflecting telescope of at least 25 cm (10 inches). Although there is considerable scope for artefacts, e.g. due to subjective contrast effects, this is also true of colour CCD images, e.g. due to use of different filters and image-processing. Therefore, visual colour estimation is still a worthwhile project.
Some observers have made intensity estimates of belts and zones through red and blue filters and this should also be a means of recording colour. A project for an experienced observer could be to systematically compare visual colour impressions, visual red-minus-blue estimates, and colour impressions on processed CCD images, and to calibrate them against absolute intensity measurements on multi-filter CCD images.
Estimates of the intensity (darkness) of belts and zones can be made numerically, on a scale from 0 (brightest) to 10 (black sky). They are inevitably subjective so are only worthwhile if done systematically and repeatedly within the context of a more detailed observational programme. Observers who make colour or intensity estimates should tabulate and average them for the whole apparition, and note any significant changes.
(4) Observations of satellite phenomena. The transits, shadow transits, eclipses, and occultations of the four galilean satellites are among the most striking phenomena that a beginner can observe. Although observations are not likely to have any scientific significance, observers may like to make accurate drawings of these phenomena, especially when several are occurring at once. Every six years, the satellites occult and eclipse one another, and it is interesting to plot visual light-curves of the mutual eclipses.
Contributing visual observations: New report forms have been designed (download in Word format or PDF). These will be sent to members who request them from the Director, either as hard copy (in which case, please make extra photocopies yourself), or as Word files by e-mail. Observers are invited to use whichever form is more suitable for the observations they choose to make, or to adapt them. Please report observations about once a month during an apparition, and let the Director know at once if you see anything unusual happening on the planet.
Visual observations should be sent to the Director, either as JPEG scans by e-mail (though please keep the number and size of files reasonably small), or as original drawings or good photocopies by post. Send an e-mail address or a stamped addressed envelope if you would like acknowledgement. If better copies are required for publication, we will request them from you. If you would like to form an informal 'news-group', we will be happy to put you in touch with other members who also send drawings by e-mail.
CCD imaging has transformed the amateur record of the appearance of Jupiter. Images can enhance Jupiter's rather low contrast, and can provide accurate measurements of both latitude and longitude. For the Jupiter Section, these measurements are now made using the computer-based JUPOS system, and they enable us to track numerous features large and small.
In general any telescope of good quality is suitable. For quality refractors 10cm and larger aperture will produce good results. For reflectors 15cm and larger aperture will produce very good resullts. Telescopes of 20-40cm can produce extraordinarily detailed images under steady seeing conditions.
Affordable webcam technology now allows observers to capture a great amount of detail on Jupiter. If a colour webcam is to be used (such as the Philips ToUcam) the observer should employ an IR blocking filter to ensure the image is not "polluted" with IR signal (since CCD chips are very sensitive to the wavelengths.)
RGB imaging can also easily be undertaken with a set of good filters (again ensure that the IR signal is blocked either by use of a seperate IR blocking filter or IR blocking coated colour filters. Images need to be obtained quickly for combination into a tri-colour image due to Jupiter's fast rotation. The observer has only 2-3 mins at the very most before rotation induced smearing will occur.
Image processing, using Registax or other software, is
necessary to bring out the planet's limb, and is desirable to enhance contrast
and perhaps to sharpen edges. Such image-processing should be done judiciously
with awareness of the artefacts that it can create; check that there are not
conspicuous rings around satellite shadows, nor any saturated white areas in the
image. Sharpening in particular may enhance the appearance but make it less
reliable.
Images in different filters can be very informative as one sees different levels
in the atmosphere. Near-infrared (~800 nm) images show much small-scale detail
as they penetrate some way into the main clouds. Observers with large telescopes
and good CCD cameras can also take images in the ultraviolet (~360 nm) and the
methane absorption band (890 nm), which reveal the high hazes in the atmosphere.
For Further technical information and advice on CCD/Webcam imaging of Jupiter please contact Damian Peach.
Contributing images:
Please send images, by e-mail or on disk, to the Director. They are more
likely to be used for analysis if sent to us directly rather than just being
placed on a web site. You are also encouraged to send copies of images to two
international archive sites:
1) International Outer Planets Watch (professional site): http://www.pvol.ehu.es/pvol/
2) ALPO-Japan (amateur site):
http://alpo-j.asahikawa-med.ac.jp/indexE.htm
Filenames must include the date in the order year-month-day, followed by the
observer's name or initials. The order year-month-day (with the year
written in full) is essential to avoid confusion due to dates written in
different formats. Our preferred format is: 2012nov01_ABC. But we
are also happy to accept the format used by IOPW/PVOL:
j2012-11-01_01-56_ABC (which includes the time, here 01:56 UT).
Please include the same information in the subject line of your e-mail. You may
include several images from one night in one file. If the file contains a single
image, please include the time (always in UT, and preferably accurate to a tenth
of a minute) in the filename, to facilitate filing in the JUPOS database; thus,
2012nov01_01565_ABC(for an observation on 2012 Nov.1 at 01h 56m 30s UT by
observer ABC).
Please write all essential data on the image (not as a separate text file). This
should include the full date and time (UT); CM1, CM2, CM3; your name, and the
colour channel(s) used. If you produce images with a separate luminosity channel
('LRGB' images), it is essential to state what waveband is used for the
luminosity channel, and we strongly recommend that only white should be used.
(Images with red or infrared for luminosity are seriously unrealistic.) If
you use different cameras or telescopes, or observe from different countries
during the year, it is useful to have this information on the image also.
Like all amateur recorders, we strongly prefer south up in images, as noted
above. Please use enough pixels to preserve the full resolution of the
original image. The preferred format is a high-quality JPEG file.
The main quantitative analysis is measurement of longitudes and latitudes of spots, and tracking them in longitudinal drift charts. This is now done from CCD images using the computer-based JUPOS system, created by Hans-Joerg Mettig and Grischa Hahn [ref.6&7].
This allows for:
--Interactive measurement of positions of spots from images on screen (using any
image format);
--Manual input of longitudes from visual transits, if these are provided as a
consistent set tabulated in JUPOS format (see the web site);
--Output as longitudinal drift charts.
Formal printed Section Circulars are now being discontinued, in favour of more frequent e-mail bulletins. The principal address list will be the e-mail address list, comprising Section members in the UK and all contributors worldwide. E-mail bulletins are sent out whenever appropriate (approximately once a month during apparitions). Printed text copies can be sent to members in the UK if you supply the Director with some stamped addressed envelopes.
We expect to publish full reports for each jovian apparition in the BAA Journal in the usual style. Important events are also reported the news columns of the Journal, and in BAA Circulars.
References
1 Heath A. Letter. J.Brit.Astron.Assoc. 111 (no.1), 47 (2001); & replies
by Rogers and Graham.
2 Macdonald L. 'BAA Update: Meeting of the Jupiter and Saturn Sections...'
J.Brit.Astron.Assoc. 110 (no.6), 338-339 (2000).
3 Rogers JH, The Giant Planet Jupiter (Cambridge University Press, 1995).
4 Rogers JH. 'The pattern of jetstreams on Jupiter: correlation with Earth-based
observations and consequences for belt nomenclature.' J.Brit.Astron.Assoc. 100
(no.2), 88-90 (1990).
5 BAA Observing Guide (2002).
6 Mettig H-J & Hahn G: http://www.jupos.org
7 Rogers JH & Mettig H-J. 'Jupiter in 1998/99.' J.Brit.Astron.Assoc. 111
(no.6), 321-332 (2001).
8 Rogers J. 'Jupiter in 1999/2000, Part II: Infrared wavelengths.'
J.Brit.Astron.Assoc. (2003, in press)
Web pages maintained by the BAA Jupiter Section Staff.