› Forums › Variable Stars › Supernova in M101 !
Tagged: M101, Messier 101, SN2023ixf, supernova
- This topic has 85 replies, 18 voices, and was last updated 7 months, 2 weeks ago by
 Mr Ian David Sharp.
-
AuthorPosts
-
26 May 2023 at 10:57 am #617528
 Lars LindhardParticipant
Very interesting thread.
Could I make useful spectra of the SN with my StarAnalyzer 100?
26 May 2023 at 9:38 pm #617535 Robin LeadbeaterParticipant
Very interesting thread.
Could I make useful spectra of the SN with my StarAnalyzer 100?
Yes it is certainly reachable with a Star Analyser for example
https://britastro.org/observations/observation.php?id=20230523_183229_5116a1a27f78a1ea
https://britastro.org/observations/observation.php?id=20230523_194606_cc526483f5e34422but the features seen earlier have greatly reduced and at the moment even with higher resolutions it is not showing very much except a slowly cooling blue continuum. Here is the evolution with my ALPY600
https://britastro.org/specdb/data_graph.php?obs_id=13786%2C13783%2C13778%2C13774&multi=yes&legend_pos=neCheers
Robin26 May 2023 at 10:03 pm #617536Robin LeadbeaterParticipantIt seems that the R and B are slowly swapping dominance!
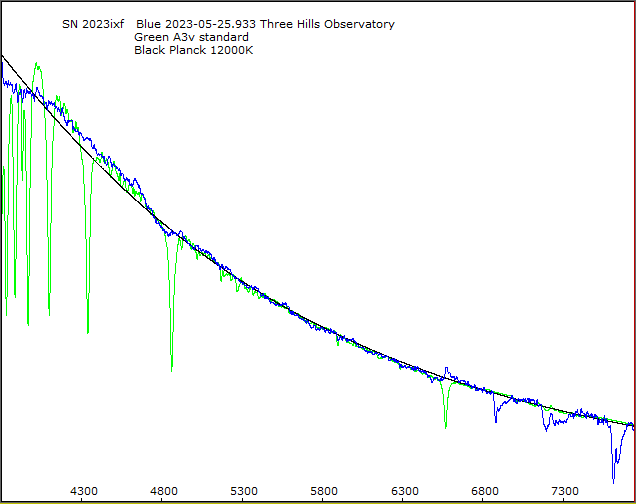
Yes my spectrum from last night shows it cooling further to a black body temperature of ~12000K and a fit to an A3v star continuum with a B-V = +0.1
Attachments:
27 May 2023 at 8:02 am #617540 Mr Ian David SharpParticipant
Yes my spectrum from last night shows it cooling further to a black body temperature of ~12000K and a fit to an A3v star continuum with a B-V = +0.1
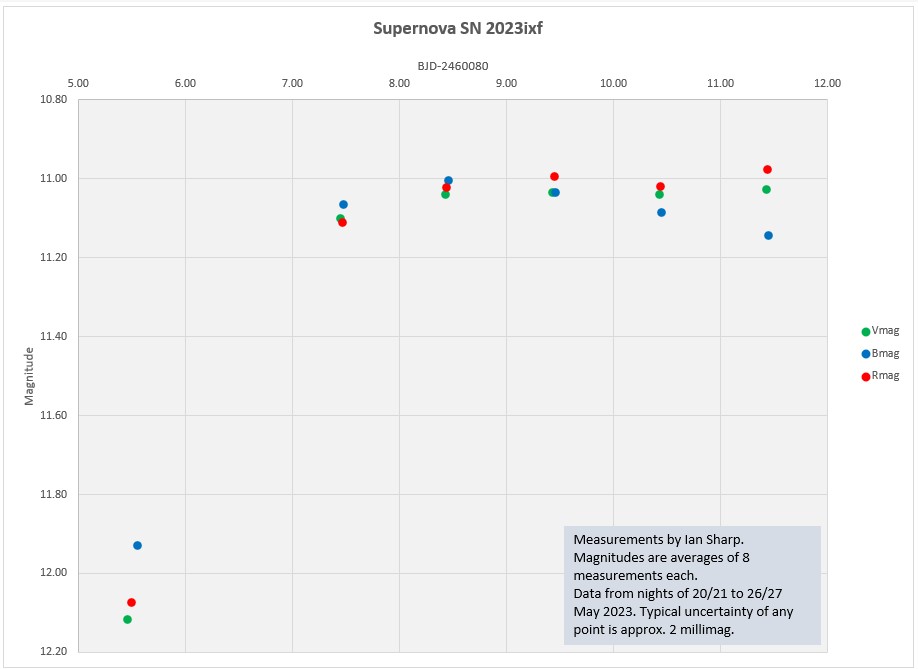
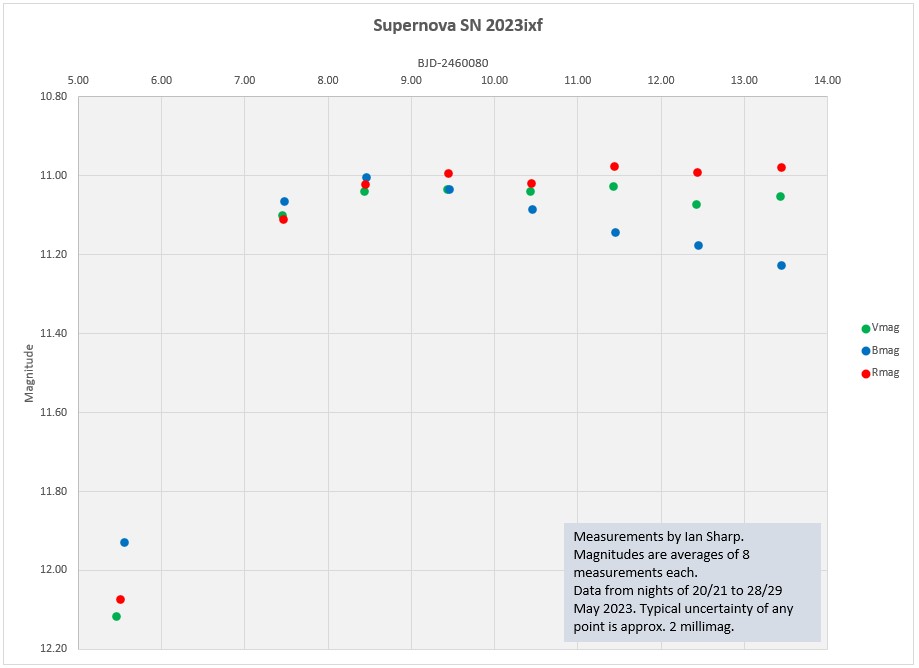
Here’s today’s RVB magnitude plot. The cooling clearly visible with the latest point B-V = +0.12.
Attachments:
27 May 2023 at 11:12 am #617542Robin LeadbeaterParticipantSo B mag peaked in just 5 days from the explosion on the 18th. That’s pretty fast I think, even for a type II
27 May 2023 at 7:09 pm #617549 Alex PrattParticipant
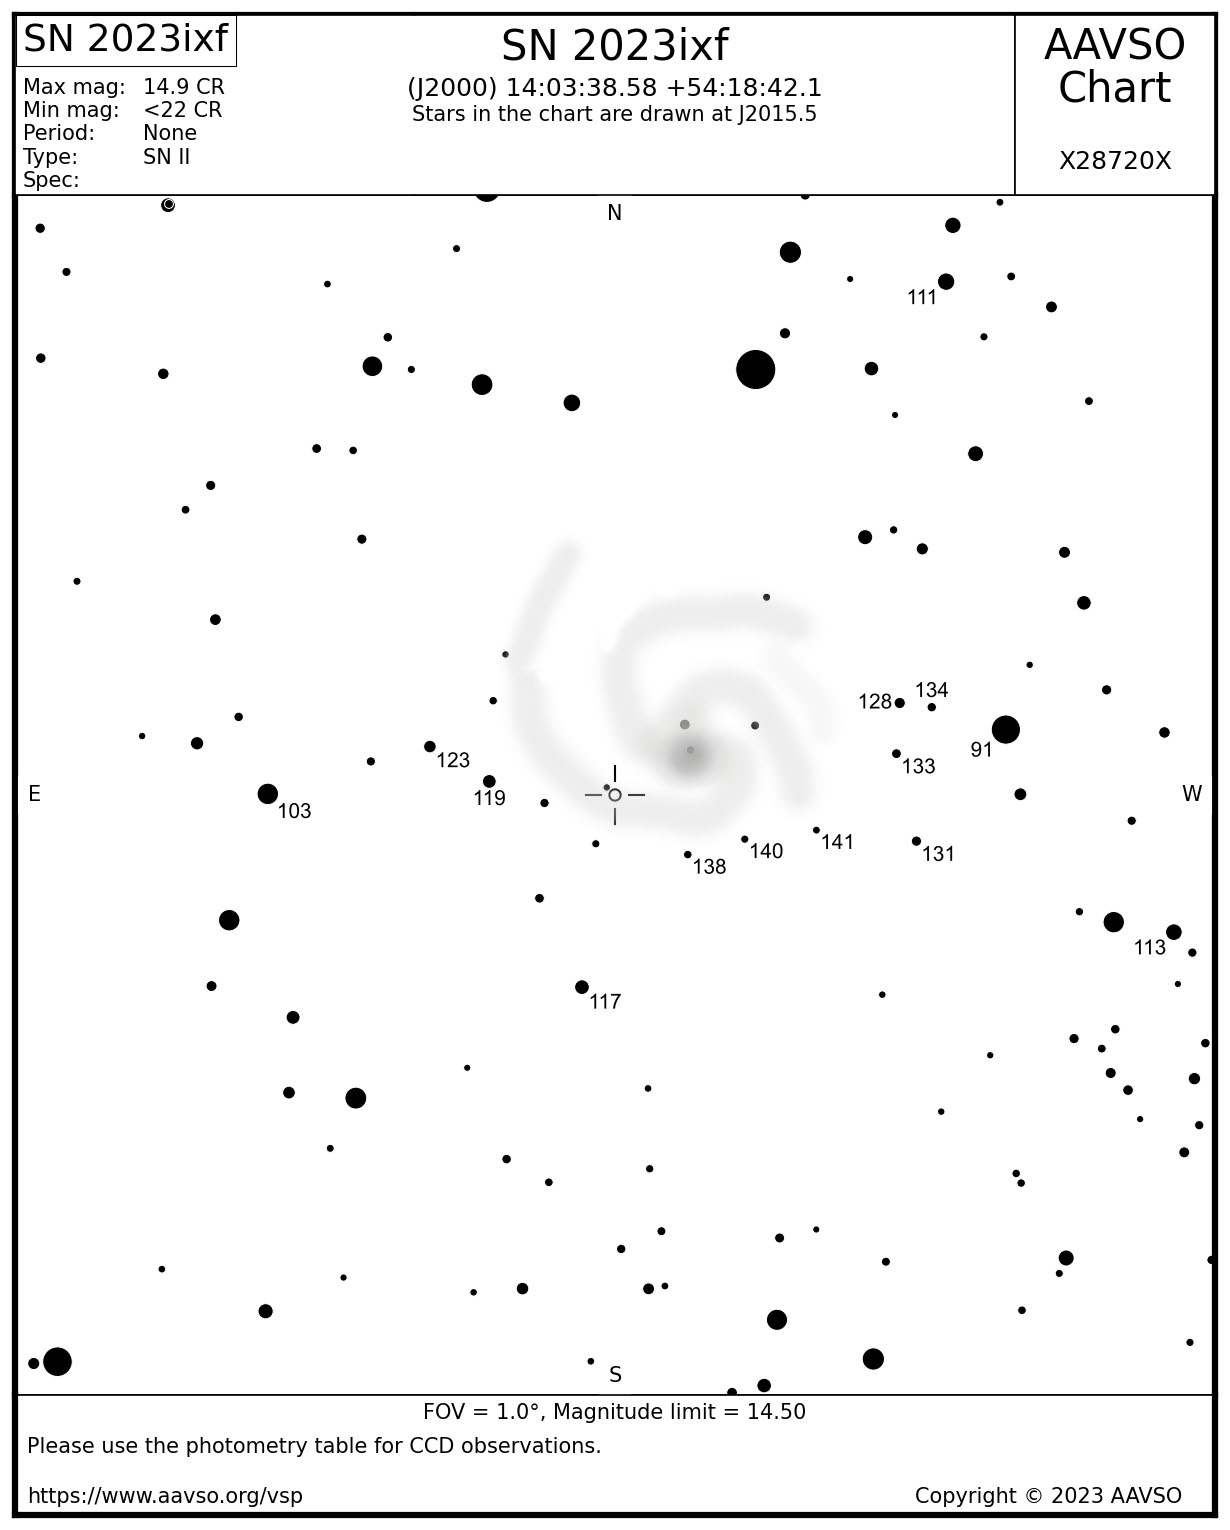
Sky & Telescope’s Bob King has provided a simple overlay of M101 and the supernova onto the AAVSO chart, if it helps visual observers
https://skyandtelescope.org/wp-content/uploads/SN-2023ixf-chart-AAVSO.jpg
Alex.
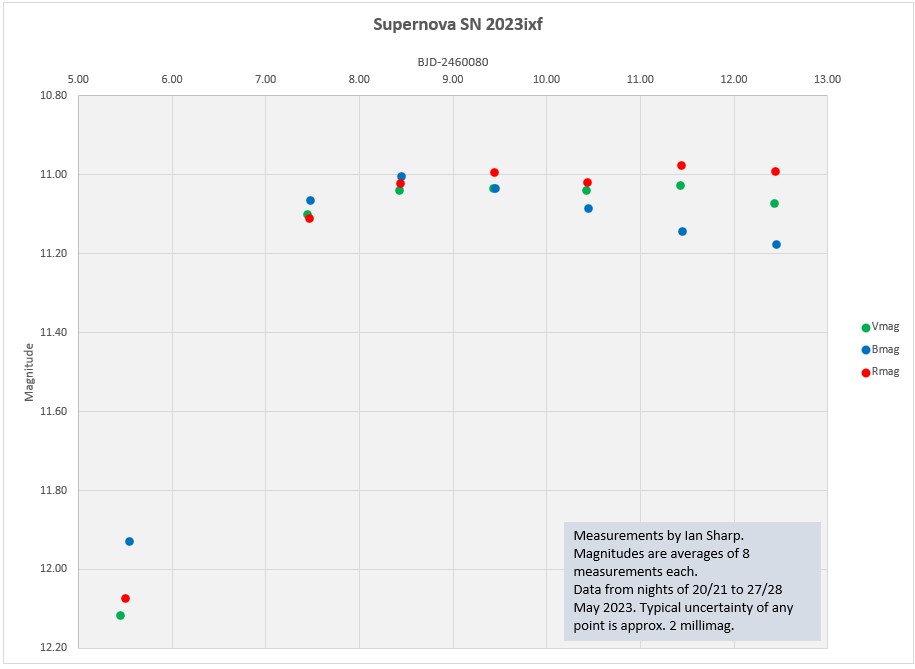
28 May 2023 at 8:44 am #617551Mr Ian David SharpParticipantToday’s update attached.
Cheers
Ian.Attachments:
28 May 2023 at 3:10 pm #617556Robin LeadbeaterParticipantThe evolving spectrum over the past week
https://britastro.org/observations/observation.php?id=20230528_140227_583fe05370c0891228 May 2023 at 7:12 pm #617560Robin LeadbeaterParticipantJust listened to an excellent episode of BBC World Service “Science in Action” almost entirely dedicated to SN 2023ixf
https://www.bbc.co.uk/sounds/play/w3ct4sc9
Astronomers, both amateur and professional talking enthusiastically about the discovery and what we know so far with lots of good science and even a live observing session on the radio!29 May 2023 at 8:21 am #617564 Nick JamesParticipant
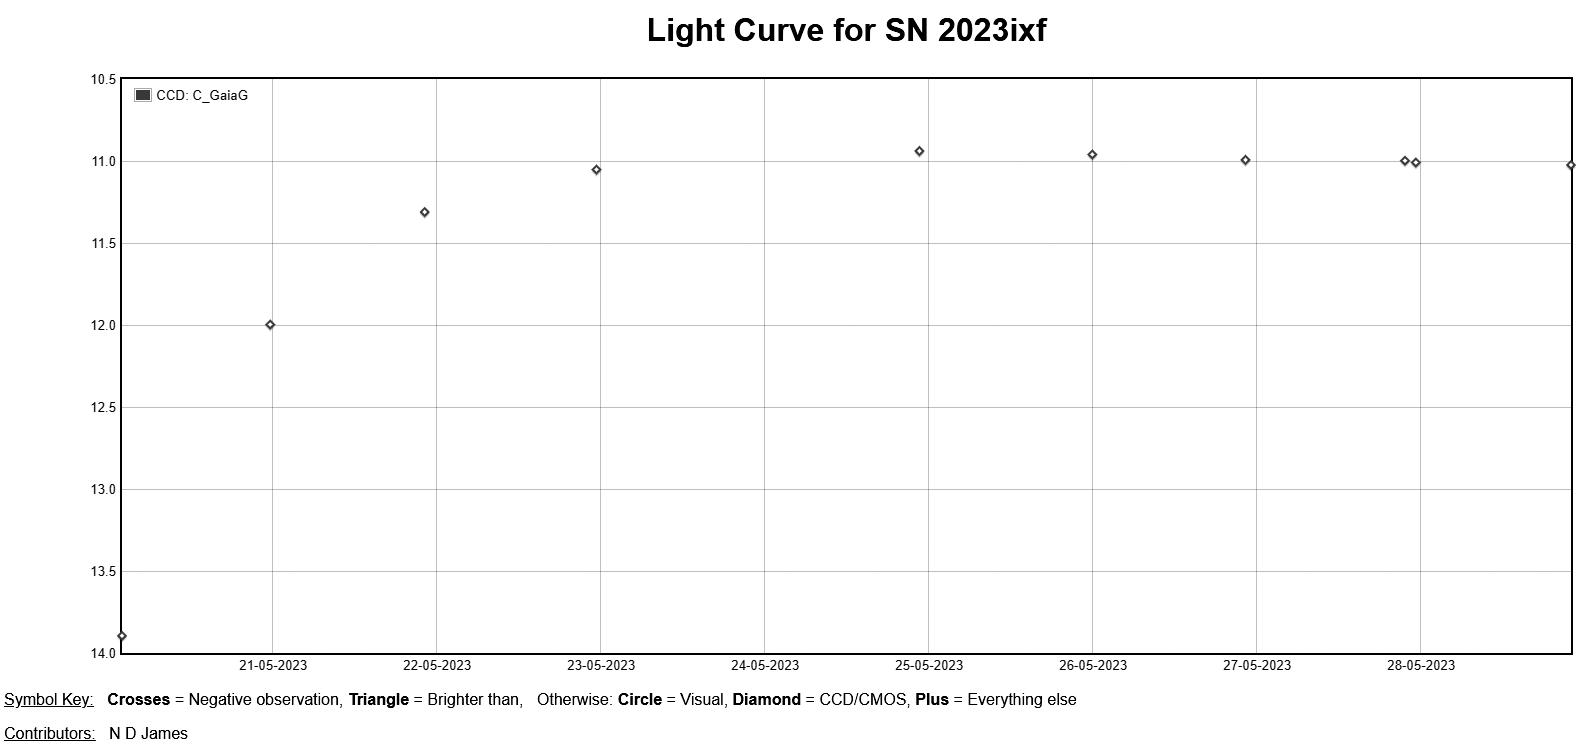
Robin – That was a very interesting programme. Some of the BBC’s science output is still pretty good. Here’s my lightcurve so far taken from the BAA database. Hopefully this good weather will continue so we can keep monitoring it.
-
This reply was modified 10 months, 3 weeks ago by
 Andy Wilson.
-
This reply was modified 10 months, 3 weeks ago by Andy Wilson.
Attachments:
29 May 2023 at 9:34 am #617566Mr Ian David SharpParticipantGood morning all,
See the attached for the graph of my continuing nightly R, V and B measurements. The continuing drop in blue magnitude is fascinating. B-V was +0.18 last night.
Cheers
Ian.Attachments:
29 May 2023 at 11:50 am #617575 Andy WilsonKeymaster
Apologies to Nick, I accidentally deleted his light curve of SN 2023ixf. Now added back after Nick sent me a copy.
As an admin I have delete and detach links, next to the link to view attachments. I must have hit one of those when trying to view his light curve.
It is great seeing all the photometry and spectroscopy of this supernova.
Andy
-
This reply was modified 10 months, 3 weeks ago by Andy Wilson.
29 May 2023 at 10:23 pm #617580 Alan ThomasParticipant
Thanks Robin. A very interesting and well-produced programme on SN2023ixf. Especially enjoyed the observing session!
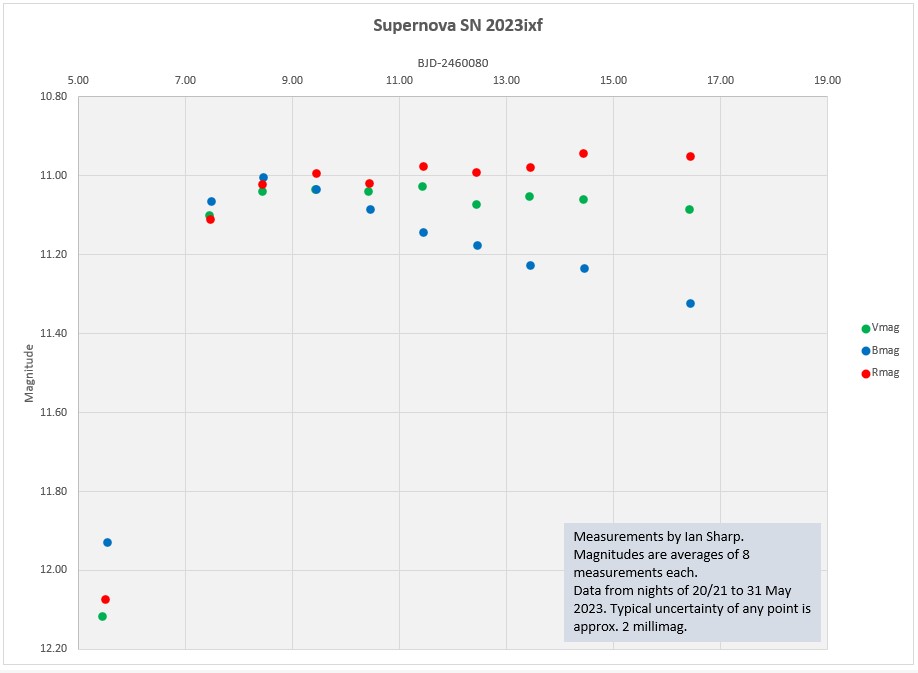
Alan1 June 2023 at 9:49 am #617599Mr Ian David SharpParticipantHere’s my latest graph including last night’s results (31st May). I make B-V = +0.24.
Ian.Attachments:
1 June 2023 at 11:25 am #617601Lars LindhardParticipantAny explanation for the drop in blue magnitude?
1 June 2023 at 12:17 pm #617602Andy WilsonKeymasterI suspect the drop in the blue magnitude is due to the material cooling as the ejecta of the supernova expands. Taking a first approximation of a black body, then the shorter frequency blue light will reduce first as the explosion cools. You can see the effect in Robin’s spectra animation from a few days ago.
With the caveat that I am not an expert on supernova, so someone else may be able to jump in to confirm or refute this notion.
Andy-
This reply was modified 10 months, 3 weeks ago by Andy Wilson.
1 June 2023 at 1:20 pm #617604Mr Ian David SharpParticipantAny explanation for the drop in blue magnitude?
Yes, as Andy has explained – cooling.
Ian.1 June 2023 at 1:36 pm #617605Jane Clark
ParticipantHi:
Since type II supernovae are hydrogen-rich and type I are hydrogen-poor, would shooting through a hydrogen alpha filter be a quick-and-dirty way to distinguish them without spectroscopy?
Thanks,
Jane.
Jane Clark
1 June 2023 at 8:16 pm #617608Robin LeadbeaterParticipantSince type II supernovae are hydrogen-rich and type I are hydrogen-poor, would shooting through a hydrogen alpha filter be a quick-and-dirty way to distinguish them without spectroscopy?
Hydrogen present (in type II) or absent (in type Ia,b,c) in the spectrum would be a better description. The problem is other events also pretend to be type II supernovae like novae, dwarf novae, luminous blue variable supernova impostors etc. You need the detail of a spectrum to be sure of what you are looking at. The spectrum of supernovae also vary with time and with type II, H alpha emission does not really dominate the spectrum for a lot of it and when it does it is often a combination of emission and absorption (a P Cygni shape line). When typically measured a few days after discovery the type II spectrum can be almost devoid of features. This one was discovered early so did show some H alpha emission early on but even then the dominant feature was that is was very blue and currently it looks almost like an A type star but without hydrogen absorption lines, just a very small P Cygni H alpha line. See here the evolution of the spectrum over the first week.
https://britastro.org/observations/observation.php?id=20230528_140227_583fe05370c08912For a more general overview of using spectroscopy to classify supernovae I did a talk about it here
https://britastro.org/videos/using-low-resolution-spectroscopy-to-confirm-supernova-discoveries-2
In essence it is done by matching the spectrum to templates of various types of supernovae taken at different times
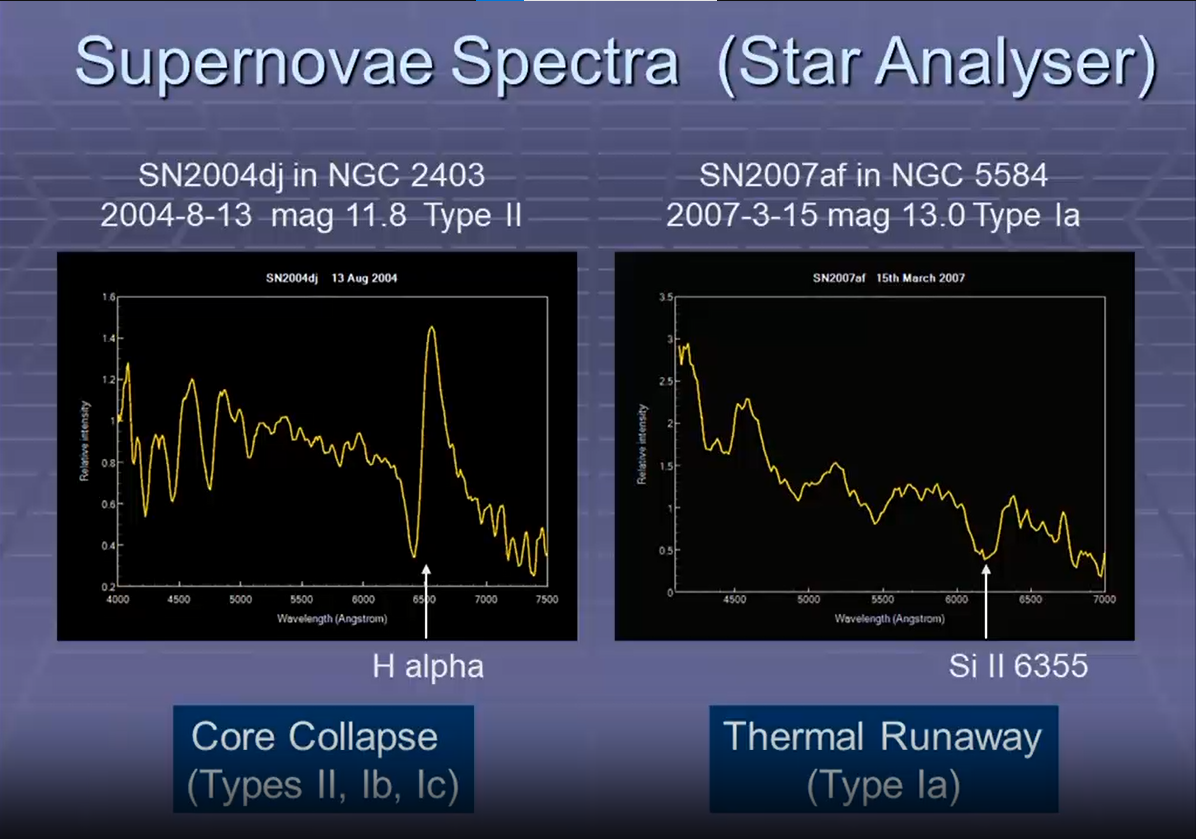
Attached is an example from the presentation of type Ia and type IIP spectra around or after maximum light. I think it would not be straightforward to distinguish them from just H alpha and broad band imagesCheers
Robin-
This reply was modified 10 months, 3 weeks ago by
 Robin Leadbeater.
Attachments:
1 June 2023 at 8:22 pm #617610Robin LeadbeaterParticipantAttached is an example from the presentation of type Ia and type IIP spectra around or after maximum light.
Incidentally Koichi Itagaki also discovered both of these supernovae
-
AuthorPosts
- You must be logged in to reply to this topic.