Reference list of Jupiter's Jets (2013, March.)
The
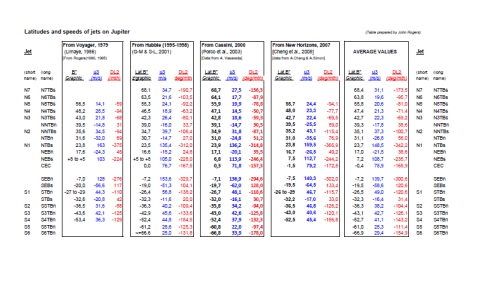
jets (jet streams) are the key structural features of Jupiter’s atmosphere,
particularly the prograde jets which are narrow and essentially fixed in
latitude. This table gives the peak
speeds and latitudes of the jets from each of the four major spacecraft data
sets up to 2007.
The jets divide the atmosphere into dynamical units which correspond to the visible belts (cyclonic) and zones (anticyclonic). We have previously named the jets according to the name of the adjacent cyclonic belts which they notionally delimit: for example, the NTBs and NTBn jets bound the south and north edges, respectively, of the North Temperate Belt. But at higher latitudes, the dynamical patterns are not represented by visible belts and zones, so this nomenclature is less useful. Therefore, we propose the simpler and more accurate convention of labelling the domains and the prograde jets in order as S2, S3, S4... and N2, N3, N4..., as shown in the figure below:
Click above for PDF
download
The
table includes all the prograde jets, and the major retrograde jets.
At high latitudes the retrograde jets are broad and weak or variable so
they are not listed. Speeds are
given as u3 (m/s in System III), which we have also converted to
DL2 (degrees per 30 days in System II). Some
values have been optimised by averaging or interpolating between adjacent
latitude bands. Voyager data are
from Voyager
1; the Voyager 2 data were not significantly different.
The
Cassini data appear to be the best in quality, and agree quite well with HST,
though all Cassini's far-northern speeds are unusually slow. Both also extend to
higher latitudes than the Voyager values. But the HST speeds are systematically
~6 m/s more positive than those from Voyager and Cassini, which suggests a small
systematic error in one or more of the data sets.
The Voyager latitudes are ~1 deg. higher than HST's at high latitudes;
Cassini's are intermediate. The
differences between these data sets have been discussed in detail by G-M &
S-L (2001) and A-D et al.(2011).
The
New Horizons images had lower resolution than the others, and speeds were only
calculated at 0.5 deg. intervals. Nevertheless, they agree well with the mean of
the other data for most jets, and they give the fastest values for some jets
(values which are consistent with our ground-based data as noted in our report
for 2007).
In
most respects the four data sets are remarkably similar.
Asay-Davis et al.(2011) note that the typical scatter of ~10 m/s within
each data set represents short-term fluctuations in the winds on timescales from
hours to months, so that differences of this magnitude between data sets are
probably not significant. There are
probably similar variations with longitude. Full
discussion of the similarities and differences is beyond the scope of this note,
but for the prograde jets, there are no definite shifts in latitude (although
the profiles of some jets may vary), and in most cases only minor differences in
speed.
The
most significant variations in speed are shown by the strongest prograde jets:
--NTBs
(switching between ‘normal’ state [1995-2000] and ‘super-fast’ state
[1979, 2007]);
--NEBs
(little variation in these data sets, but much faster in 2008 and 2011);
--SEBn
(modulated by the SED);
--STBn
(two variable sub-peaks).
These
variations are covered in detail in our other reports on this web site.
References:
Limaye
SS (1986) Icarus 65, 335-352. ‘Jupiter: new estimates of the mean zonal flow
at the cloud level.’ [Voyager 1.]
Garcia-Melendo
E & Sanchez-Lavega A. (2001) Icarus 152, 316-330. 'A study of the stability
of jovian zonal winds from HST images: 1995-2000.'
Porco
CC et 23 al.(2003) Science 299,
1541-1547. ‘Cassini Imaging of Jupiter's Atmosphere, Satellites, and Rings.’
[Data were kindly provided by A. Vasavada.]
Cheng
AF et 14 al. (2008) Astron.J. 135, 2446-2452.
‘Changing characteristics of Jupiter’s little red spot.’
[Includes global zonal wind profile from New Horizons: Fig.1d.
Data were kindly provided by A. Cheng & A. Simon-Miller.]
Asay-Davis XS, Marcus PS, Wong MH & de Pater I (2011) Icarus 211, 1215-1232. Changes in Jupiter’s zonal velocity between 1979 and 2008. [Comparison of all data sets.]
-------------------------------------------------------------
John H. Rogers, Ph.D. Jupiter Section Director,
British Astronomical Association
jhr11@cam.ac.uk
http://www.britastro.org/jupiter/