
The main aim of this page is to give observers an easy-to-read summary of where solar system objects are now and will be in the near future, and whether the Moon is likely to interfere with observing them. Thus it is a tool for the initial stages of planning observing sessions. An observing list can be compiled (with RA, Dec, etc) in a format that can easily be pasted into a spreadsheet.
The plot shows the whole of the celestial equator and a band 45 degrees north and the same south of it. It is plotted in such a way that the Sun is always at both ends. The vertical scale divisions are 10 degrees of declination. The top scale shows right ascension (RA) and the bottom scale shows elongation in degrees eastwards from the Sun. Elongation 180° is the meridian at midnight. Any planet on the meridian is at opposition. Objects to the right of it are evening objects, those to the left are for observing in the morning.
Initial letters are used for identifying the planets. The two M's are distinguished by Mercury having a small letter and its dot being cyan, whereas Mars is orange.
The sizes of the Sun and the Moon are exaggerated, so it means nothing if planets appear in front of them (Sun and Moon are always plotted before planets).
The short green lines through the Sun are tangents to the horizon at sunrise and sunset for the given latitude. The parallel grey lines indicate the astronomical twilight zone: objects between the grey and green lines will only be seen in twilight (the Sun is not yet 18 degrees below the horizon). In summer at higher latitudes, such as in the UK, astronomical twilight never ends and then the grey twilight lines do not appear on the plot.
The horizon tangents indicate whether objects close to the Sun are likely to be observable at all. Consider sunset on 2013 April 16. The leftmost of these images is the view as seen from latitude 54.8°N:
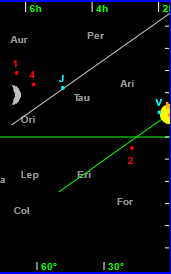
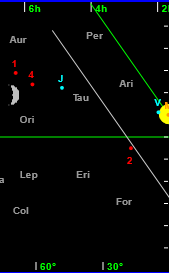
In this view asteroid 2 Juno is 23° from the Sun (as could be verified by clicking on it and examining the data consequently displayed for it). It cannot possibly be seen from this latitude because it is below the horizon at sunset. However, an observer at latitude 35°S might have a chance of seeing it as the chart for that latitude shows - the middle image here.
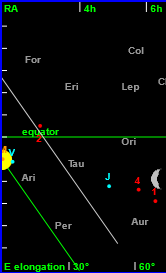
A southern observer would probably use the southern view, with sunset on the left, as in the third image here.
The horizon tangents do not connect up on our display because they are for different times: sunset and sunrise on the chosen day.
Below the middle of the plot are fields for entering the observer's latitude and longitude. The values are remembered by keeping a cookie in the user's browser (this is our only use of cookies). Having both of these values enables several useful values to be calculated and reported for celestial objects: hour angle, azimuth, altitude and topocentric RA & Dec.
Observers north of the equator tend to face south when observing objects along the ecliptic. The rising Sun would then be to their left and the setting Sun to their right. For observers in the southern hemisphere the opposite is true, so the display is rotated through 180° when the button is clicked. These controls are for switching between topocentric coordinates (from the observer's location) or geocentric coordinates (from the centre of the Earth). The difference is negligible for all but the closest objects, those for which Δ (distance from Earth) is much less than 1au; that means Near Earth Objects (NEOs) or the Moon. You can make comparisons by putting details in the observing list for the same object in both topocentric or geocentric mode.Moving the mouse cursor over the plot highlights the nearest object and displays its name in full. Clicking the mouse when a name of interest is shown causes the area below the right side of the plot to show summary data for the object including its position (RA and Dec), rising and setting times, etc.
Data for the Sun also include local mean times for the start and end of the various levels of twilight.
For the Moon we include a number which is the Moon's distance from the centre of the Earth as a proportion of the interval between the closest possible perigee and the furthest possible apogee. This enables "Super Moons" to be predicted, if you enjoy the media's absurd fascination with such events. More usefully it can tell you when first or last quarter are nearest to us and therefore might show more detail.
The summary data for an asteroid or comet includes the values of r (distance from the Sun), Δ (delta, distance from the Earth) and the phase angle between the two vectors to Earth and Sun. For comets a magnitude estimate is calculated by the formula 5.log10(r.Δ). The display for an asteroid includes a V magnitude estimate based on H, G, r, Δ and phase angle. The theory behind this was explained in "The H and G magnitude system for asteroids" by Roger Dymock in the BAA Journal: J.Br.Astron.Assoc. 117,6,2007 p.342. Our display uses the formulae given in that paper.
The data summary area also includes some option buttons, depending on the object type. In most cases a much more detailed finder chart showing just a few degrees around the object and stars down to about magnitude 11 can be plotted. The text labels on the detailed chart may be moved with the mouse if they are obscuring something useful.
Data in the summary area may be copied easily by selecting the text with a mouse. In Windows then use Ctrl-C to copy it to the clipboard. From there it can be pasted into anything that accepts text. In other systems there will be a similar process but with different key combinations. In this way you can compile a list of objects that are favourably placed for observation and perhaps go on to research their details elsewhere.
In fact the page itself maintains an observing list as a table below the plot. A button in the summary data area makes it easy to add an object's data as a new row in the table. To copy the table select it all with a mouse, then Ctrl-C to copy it to your system's clipboard. From there it can be pasted into a spreadsheet or a text editor.
You can add further objects to the plot by means of the various buttons and remove them all again with the button. The following kinds of objects may added.
The lists contain hundreds of asteroids and comets. It can be useful to add a whole list first. That enables you to see which objects are in a suitable part of the sky for your location, so they are likely to be observable. You can then clear the list and concentrate on the most interesting objects. Type the start of a name to get into the right part of a long list. The list of asteroids comprises all those reaching magnitude 12.0 or brighter at the next opposition (or at a recent opposition).
The Kreutz search area refers to the position in the sky which is likely to be the best place to look for comets of the Kreutz group, ahead of opposition, giving you a chance to be the first to discover one! The theory of this is given in two papers by Brian Marsden:
There is more introductory information about the Kreutz Sungrazers in the book
Our display gives considerable information about the likely positions of Kreutz comets at various numbers of days ahead of opposition. The details may be charted and tabulated.
One kind of object that can be plotted is static (non-orbiting) objects. The aim is to help beginners in particular to see when any object is likely to be observable. Once the name of a static object has been entered the program automatically asks the Simbad service at CDS Strasbourg for the coordinates of the object. In naming such objects 3-letter abbreviations may be used. For example, to plot Alpha Orionis it is sufficient to put "alp ori". The full naming rules can be seen on the Simbad web site.
Our program implements many of the algorithms given in "Astronomical Algorithms" (2nd edition) by Jean Meeus, henceforth referred to as AA.
The heliocentric positions of all the major planets, including the Earth, are calculated according to the VSOP87 theory, as described in AA Chapter 32. The position and phase of the Moon are calculated using Chapront's theory as described in AA Chapters 47 and 48. So we display positions for the Sun, Moon and major planets accurate to about 1 arc second.
The calculation scheme for the orbits of asteroids and comets is from AA Chapters 33 to 35. The calculation uses the latest osculating orbital elements from the Minor Planet Centre. This is accurate enough for this small image display and for a few years around the present time. It is not useful for dates many decades or centuries from the present.
Coordinates are first calculated relative to the geocentre but are then converted to topocentric (if selected) by the method of AA Chapter 40.
For the way we calculate rising, transit and setting times see AA Chapter 15.
The finder charts are plotted using polar coordinates centred on the object of interest. To find the polar coordinates of a star (or any other object) relative to the object of interest we follow AA Chapter 17, on angular separation. We heed Jean Meeus' warnings about the inaccuracies of arccosines of small angles and therefore use the alternative formulae due to Thierry Pauwels, near the end of the chapter.