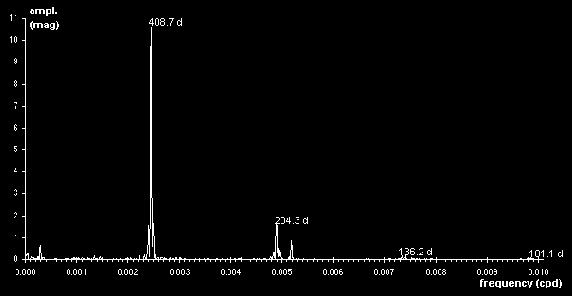
Figure 1: Fouriergram of BAAVSS chi Cygni data, 1902 to 1996.
Further to Dave McAdam's (D McA) excellent analysis of chi Cygni in BAAVSSC96, I present the following complementary results. The data used was a subset of the BAAVSS data utilised by him and is based on 85 complete maxima dating from 1902 to 1996 inclusive.
Firstly, derived elements. A totally independent analysis provided O-C derived elements of JD 2415991.6+408.68E: this gives a next predicted maximum on Nov 20th 1998, and therefore an O-C residual of -8 days in comparison to his elements. Comparison is made with elements given in the GCVS41 and the Hipparcos Periodic Variable Annex (jointly derived with AAVSO data)2 in table 1.
TABLE 1:
A comparison of chi Cygni 1998 maximum predictions from various elements
| Source | Epoch JD | Period/d | 1998 Max |
|---|---|---|---|
| D McAdam | 2411911.6 | 408.53 | Nov 12 |
| J Greaves | 2415991.6 | 408.68 | Nov 20 |
| GCVS4 | 2442140.0 | 408.05 | Oct 13 |
| HIP VA1 | 2448688.5 | 402.30 | Dec 19 |
This table in many ways highlights the differences resulting from how much data is used to derive such elements, and how current the latest observations in the dataset are. The GCVS4 will have used a complete set of data, but this data will have ended prior to the publication date of 1984. The Hipparcos value, generated in tandem with contemporaneous amateur ground based observations that were coordinated by the AAVSO, will only cover the approximate period of that satellite's mission (about 1989 to early 1993) and therefore will reflect temporary trends.
Examination of D McA's Figure 4 on p13 of BAA VSSC 96 reveals a trend of declining O-C residuals since about 1989: for 1989 to 1992 we have residuals in roughly the +10 to +25 range, whereas since 1993 we have values at 0 or below (see the last ten or so points of his figure 4). This means that calculated epochs in 1989 to 1992 were generally earlier than observed ones on average, and thus inter-maxima lengths (or "periods") were on average shorter. Hence, any elements derived at that time are bound to suggest too short a period (see Table 1).
This, however, exemplifies an ironic consequence of using O-C charts for period determination in Mira variables. At present the trend in "period" length for chi Cygni is very near the long term average for the century, so one can have confidence in the accuracy of predictions for the next few years if they are based on a period of 408 to 409 days. This would also have been the case for the late Seventies to early eighties, but would not have been the case around the late Sixties to early Seventies, O-C residuals approaching -40 days at that time for such a period.
Mira stars invariably (and almost exclusively) have inter-maxima lengths ("periods") that wander randomly either side of zero on an O-C chart, often with maximal positive deviation similar in size to the minimal one (from personal experience). D McA's analysis of chi Cygni goes a long way in illustrating the scatter in period length that these stars exhibit, and why any particular maximum will not necessarily occur within a month of predicted dates! It will be noted that use of full and up to date datasets by D McA, the 1998 BAA handbook (presumably), and myself, all provide predictions within 12 days of each other for 1998.
As mentioned in D McA's article, long term variations in Mira periodicity are no longer thought to be necessarily meaningful: indeed although an O-C chart for the past century suggests such, it should be realised that one and a half cycles are nowhere near enough to confirm this. Statistical tests give no significant evidence (not even remotely) for period change through either the cumulative sums-based approach of Isles' "span length" test or Sterne's chi2 test, although taking the correlation coefficient of a list of inter-maxima intervals compared with a copy of itself lagged by two intervals does give a better than 0.05 significance level of the period change being random, ie a low probability that such is the case (see C Lloyd, JBAA 101, 1, 46 [1991] for an overview of these procedures and further references).
Other numerical results derived from my analysis of nearly a century of BAA data for chi Cygni are given in Table 2, where they are compared with those given specifically for chi Cygni in a list of over 330 Mira and Semiregular stars with mean light curves derived from 75 years of AAVSO data3. Table 3 gives the ranges for these parameters from my analysis of the BAA data.
TABLE 2:
Mean Parameters for chi Cygni lightcurves.
The numbers given for each entry are the mean value immediately followed by
the standard deviation, followed by the total number of each phenomenon used
to derive the figures, when appropriate. (f is rise time from minimum to
maximum divided by the duration of the full period).
| Period (d) | f | max mag | min mag | amplitude | |
|---|---|---|---|---|---|
| BAA | 408.1 10.0 84 | 0.45 0.02 | 4.8 0.41 85 | 13.6 0.40 72 | 8.7 0.53 72 |
| AAVSO | 408.5 06.9 62 | 0.41 0.02 | 5.2 0.47 62 | 13.4 0.29 55 | 8.3 0.55 54 |
TABLE 3:
Ranges for the Parameters in Table 2 for the BAA dataset.
| Period | f | max mag | min mag | amplitude | |
|---|---|---|---|---|---|
| max | 431 | 0.40 | 3.9 | 12.4 | 8.5 |
| min | 379 | 0.53 | 5.9 | 14.4 | 8.8 |
Figure 1 plots amplitude in magnitudes against frequency in cycles per day for a Fouriergram analysis of the data which gave a mean period of 408.7 days, essentially that derived via O-C methods (408.68). The median period length of 407.3 days for the full data set lies near the mean of 408.1 and suggests that there have been no overall trends in period change throughout the century, that is the scatter in period lengths has been quite evenly distributed about the mean. However, a modal period of 404 days suggests a bias towards longer periods at some point thus a larger mean value, or a preponderance of the number of longer periods over that of shorter ones, although the difference is negligible. The final series of figures illustrates many of these points graphically, so that readers can judge for themselves.
Figure 1: Fouriergram of BAAVSS chi Cygni data, 1902 to 1996.
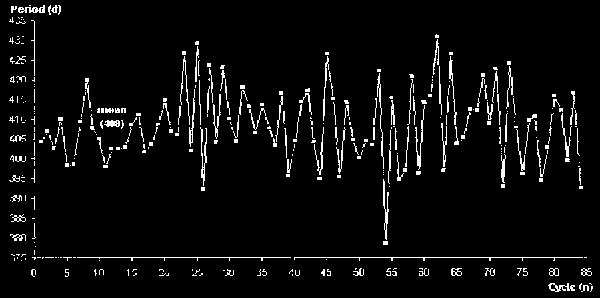
Figure 2: Inter-maxima lengths (periods)
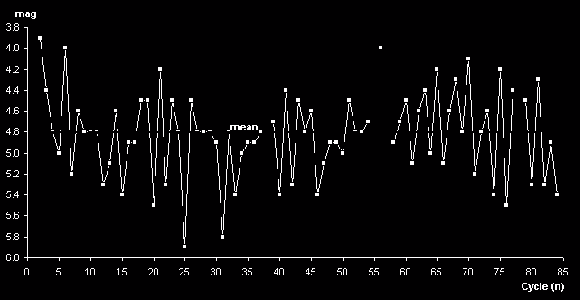
Figure 3: Maximum magnitudes (gapped lines denote non-consecutive data points)
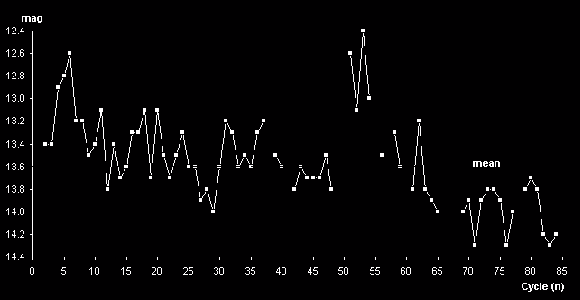
Figure 4: Minimum magnitudes (gapped lines denote non-consecutive data points).
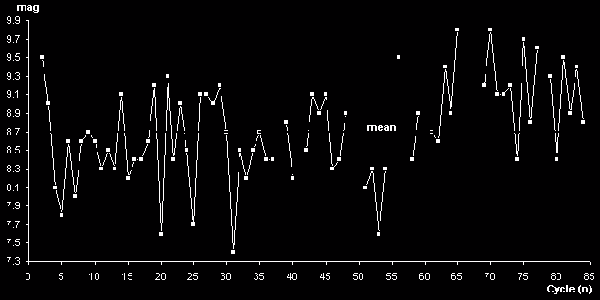
Figure 5: Amplitude variation, in magnitudes (gapped lines denote non-consecutive data points)
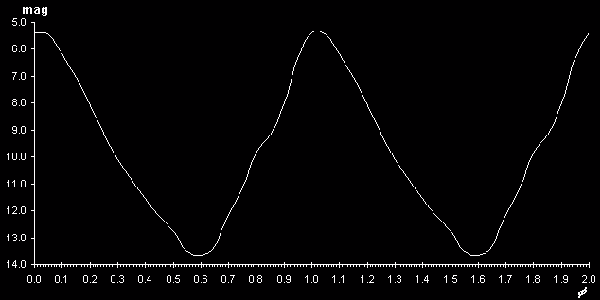
Figure 6: Phase diagram showing representative chi cygni light curve generated
by folding approximately 4000 observations from JD244551 to 2450720 on the
mean period (with no binning). Mapped as two complete cycles for illustrative
purposes.
The Maxima of Chi Cygni D McAdam