Observation by Nick James: Pressure wave from Hunga Tonga-Hunga Ha&...
Uploaded by
Nick James
Observer
Nick James
Observed
2022 Jan 15 - 19:00
Uploaded
2022 Jan 16 - 00:31
Objects
The Earth
Equipment
Location
Chelmsford, UK
Target name
Earth's atmosphere
Title
Pressure wave from Hunga Tonga-Hunga Ha'apai
About this image
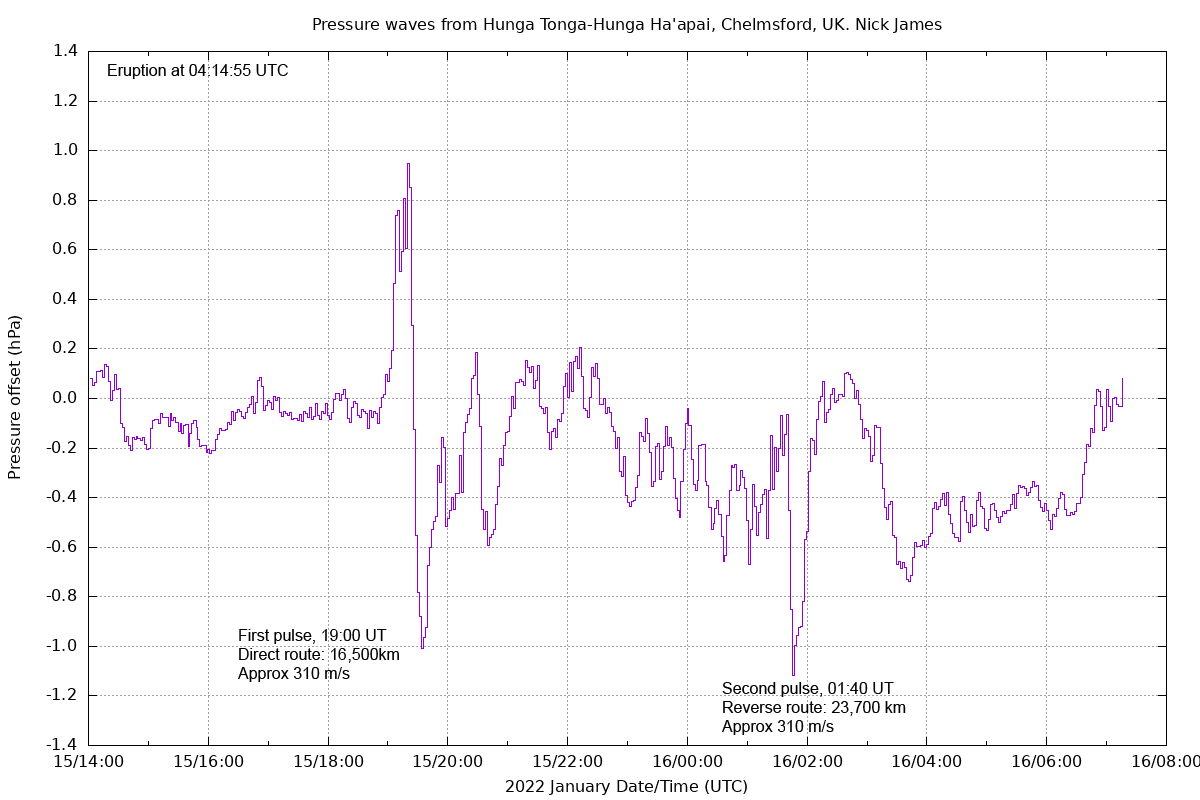
It's pushing the definition of astronomy a bit but this is the Earth's atmosphere so it sort of counts. This is a recording from my observatory weather station as the pressure wave from the gloriously named Hunga Tonga-Hunga Ha'apai volcanic eruption passed over the UK earlier this evening. The volcano is half way around the world in Tonga, around 16,500 km great circle distance, and it had a huge explosive eruption at 04:14 UTC this morning. The pressure wave arrived here at just after 19:00 corresponding to a speed of 310 m/s (the speed of sound at sea level is around 340 m/s). The second pulse just before 2am was the pressure wave going the long way around in the other direction.
Files associated with this observation
Like this image
Alan Thomas,
Eric Watkins,
Jeremy Shears,
Ron Johnson,
Grant Privett,
Mike Harlow,
Nick Quinn,
Dominic Ford,
Peter Meadows,
Alan C Tough,
Nick Busby,
Jimmy Fraser,
Robin Leadbeater,
Robert Ian Henderson,
Chris Hooker
Comments
Very interesting Nick. What make and model of weather station do you have?
Cheers
Martin
It's an RM Young 61402 barometric pressure sensor. They ain't cheap but they are very good. It has a sample period of 5s and an accuracy of 0.1 hPa. My data logger on the PC averages this to a sample period of about 2 minutes but it does store the raw data for 48 hrs. I've pulled the 5s sample data from the log and it shows all sorts of interesting structure in the first pressure pulse. We need to find an atmospheric physicist to explain it all.
This is amazing, Nick. I'm guessing it helps that Britain is almost directly opposite Tonga on the globe, so the shockwave had almost reconverged to a point.
It's weird that the second pulse only seemed to show a dip in pressure, but perhaps the preceding peak was just lost in the weather.
Indeed. it is fascinating stuff and it really shows how exciting and interesting science is. I see that the gallery has added "The Earth" to the objects list. Did that happen by magic or manual intervention? I'm not too good at filling that in and I suppose I should do better.
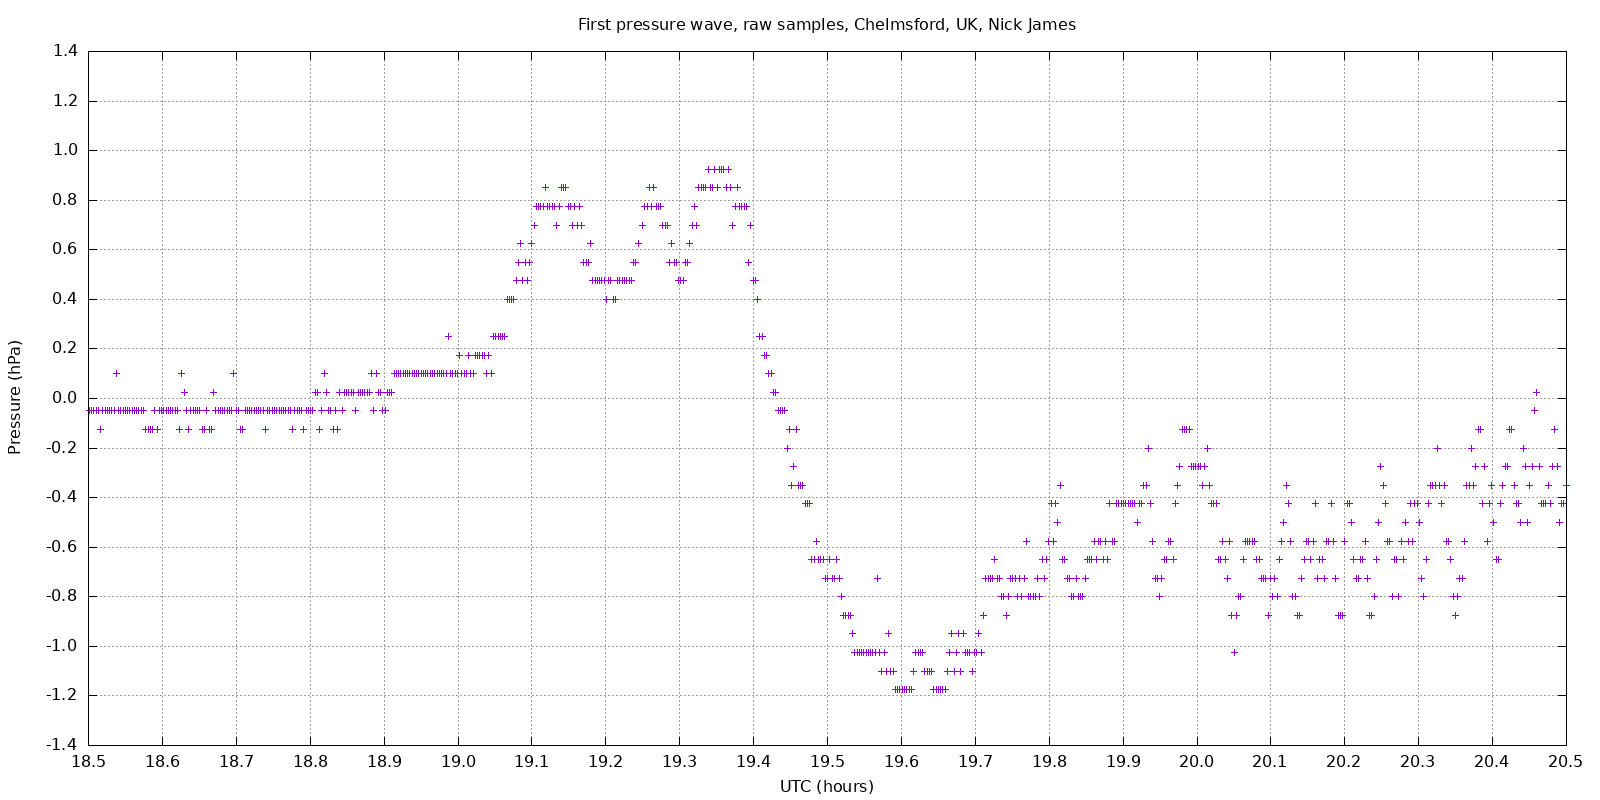
Here's the raw data plotted for the first event. It's quite noisy but shows three oscillations with amplitude around 0.4 hPa in the positive pressure part. I'd really like to understand what causes this! I guess that some of it will be due to the fact that the initial shock impulse is dispersed in time by the variable speed of sound at different altitudes. Timing of the leading edge indicates that the fastest speed is 310 m/s which implies propagation somewhere in the top of the troposphere. Other copies of the impulse arrive later since they are propagating at different altitudes so the whole thing gets spread out in a confusing way.
Yes - the speed of 310 m/s (rather than 340 m/s) is rather curious. I'll be interested to hear whether you manage to catch the next peak at T+35 hours after 1.5 circuits around the Earth. I guess that should be coming through just about now.
The object tagging was my fault. I can call up a view of all recent untagged uploads, and over coffee each morning I try to tag them insofar as possible. I figure that if the BAA is going to collect tens of thousands of images, it is essential for us to categorise them so we can find them again in the future. If you've got any objections to this, please do let me know. Though it's not relevant to this image, I also hope this makes life easier for the section directors: if images are correctly tagged, it becomes straightforward to pull up a complete list of recently uploaded observations of any particular object (or type of object).
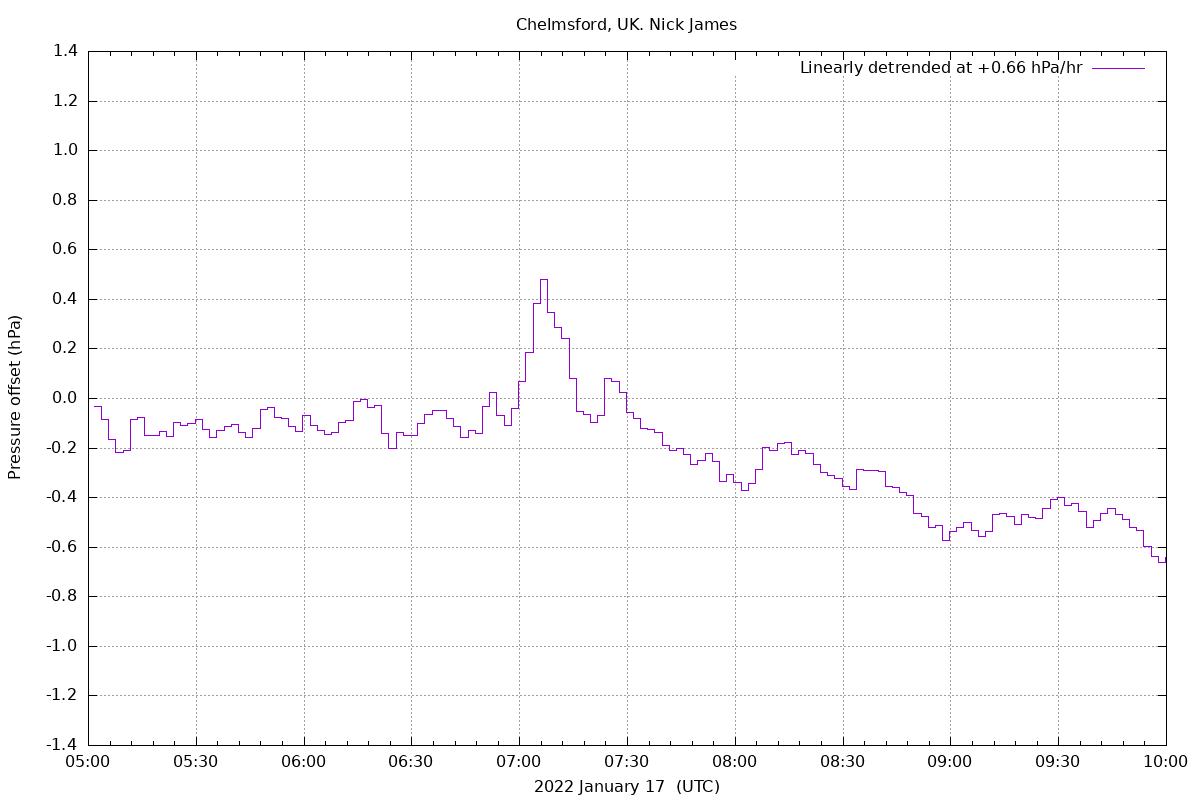
Here, on schedule is (probably) the third wave passing over Chelmsford this morning. This is 36 hours after the first wave. The Earth's circumference is 40,200 km so that implies a speed of 310 m/s again.
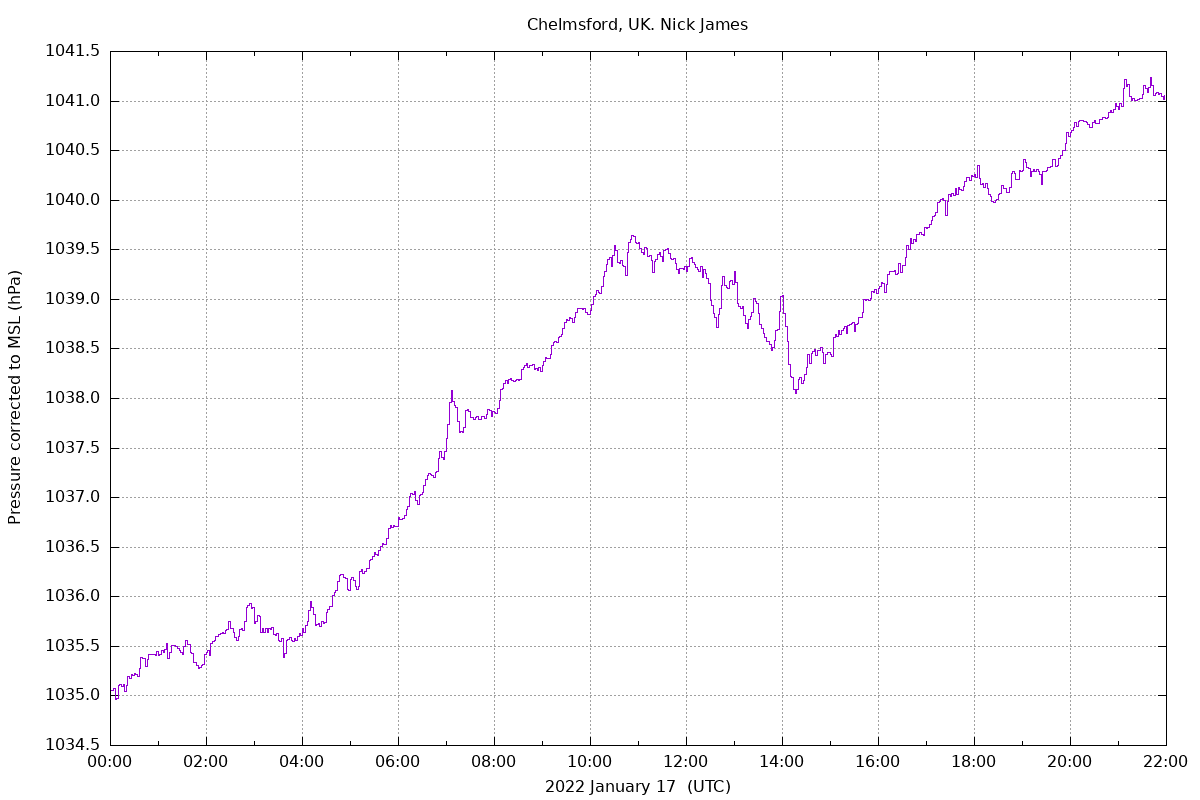
The fourth wave should have passed Chelmsford around 13:45 UTC today but I don't have an unambiguous detection since the barometric pressure was changing from falling to rising at about the same time and there are quite a lot of wiggles on the graph. There is a plot here. You can make your own mind up!
My garden weather station (Ambient WS-1001) at Alness picked up a 1mb jump in air pressure at 18.29 UT followed by a 1mb dive below what it had been. The pressure had been falling steadily all day so the blip was easy to see. A garden weather station provides a lot of interest - just a pity that a Jackdaw uses the the rain gauge as its personal toilet - the weather station is on top of a washing line pole so I have to stand on a wooden garden chair to reach it. :)
Jimmy. That's interesting. Strange as it may seem Alness is closer to Tonga than Chelmsford by around 750km so the first pulse would have got to you around 40 minutes before me. That's consistent with you seeing it at 18:29. You should have detected the second pulse 40 minutes later than me since, in that case, it had to travel further to get to you.
Nick, sorry I missed your comment but now got your email, thanks! Yes, there was a sudden dip in my air pressure around 02.34 UT on the 16th. The pressure was rising steadily by then so again easy to see. The pressure file has been sent to you.
Copyright of all images and other observations submitted to the BAA remains with the owner of the work.
Reproduction of work by third parties is expressly forbidden without the consent of the copyright
holder. By submitting images to this online gallery, you grant the BAA permission to reproduce them in
any
of our publications.