Observation by Robin Leadbeater: Supernova SN 2025rbs in NGC7331 - Spectr...
Uploaded by
Observer
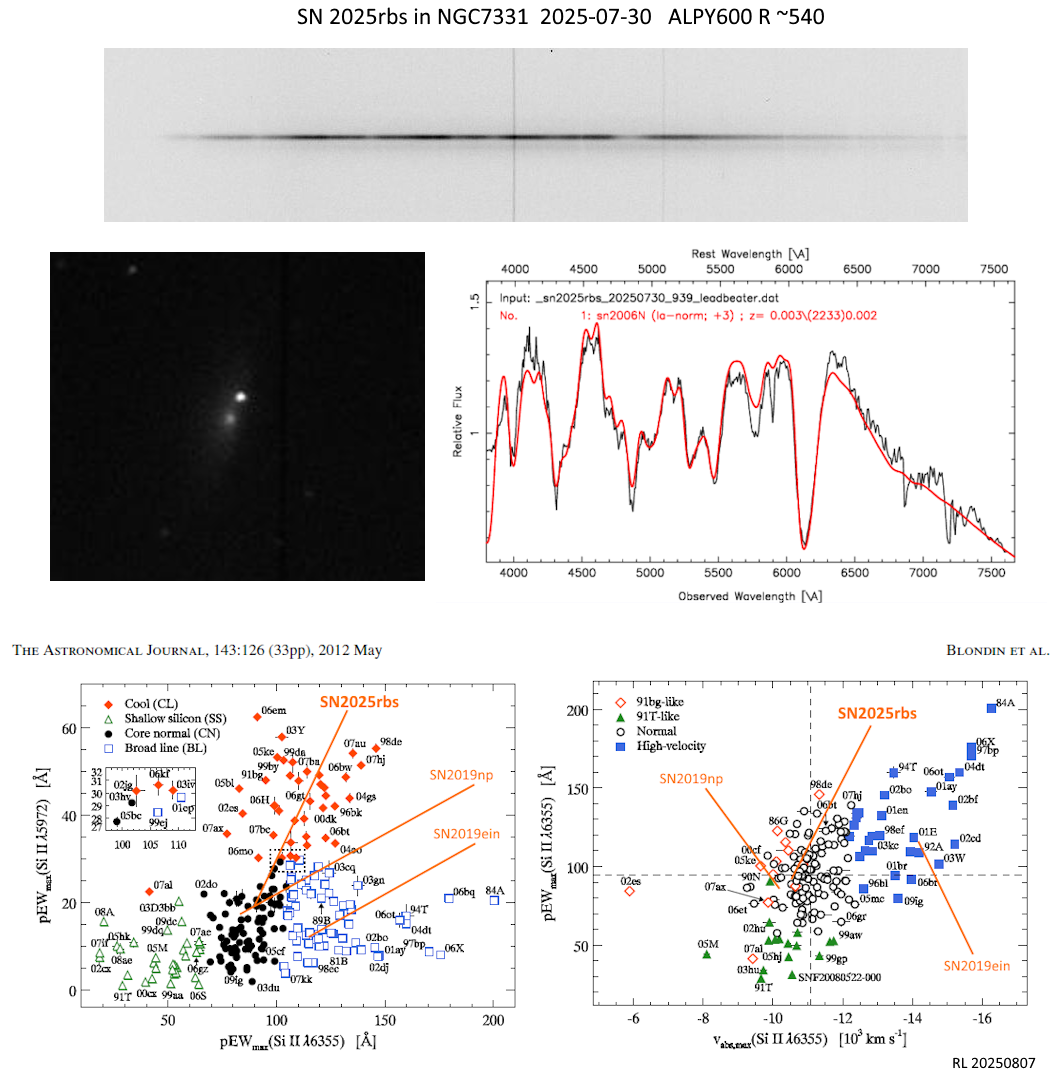
Robin Leadbeater
Observed
2025 Jul 30 - 22:32
Uploaded
2025 Aug 07 - 18:00
Objects
Equipment
- ALPY 600 spectrograph
- ATIK 428 ex camera
- Celestron C11 SCT 280mm aperture f5.5
Exposure
3600s (6x600s)
Location
Wigton, Cumbria, UK
Target name
SN 2025rbs NGC 7331
Title
Supernova SN 2025rbs in NGC7331 - Spectrum at maximum
© British Astronomical Association 2026
Registered charity no. 210769
Registered company no. 117572
For more information including contact details,
click here.
Our Terms of Use are here.
Our Privacy Policy is here.
The BAA image gallery was designed and
built by Dominic Ford.
Image gallery software
©
Dominic Ford
2020–2024