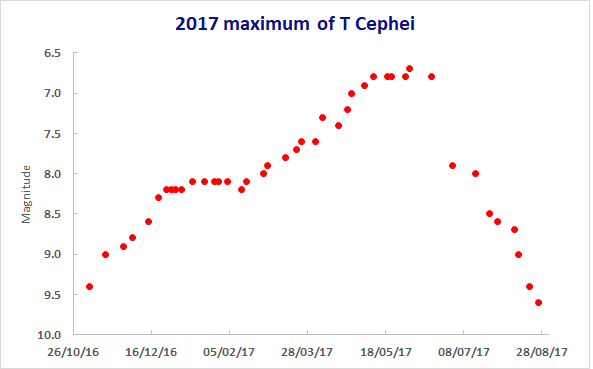
Observation by Tracie Heywood: Light curve for 2017 maximum of T Cephei

Uploaded by

Tracie Heywood

Observer

Tracie Heywood

Observed

2017 Aug 25 - 23:00

Uploaded

2017 Aug 29 - 10:34

Objects

T-Cep
Lightcurve
Variable star

Equipment
  • 11x80B
Target name

T Cephei

Title

Light curve for 2017 maximum of T Cephei

About this image

Here is my light curve for the spring 2017 maximum of the Mira type variable T Cephei.

This was a fainter maximum than in recent years. The extreme range of T Cep is 5.4-11.0, with the average peak being around mag 6.0.

Noticeable once again is the prolonged "pause" near mag 8.0 during the rise to maximum. T Cephei has always shown a brief pause at this stage in its rise, but whereas it only used to last for a week or two, those in recent years have last for 2-3 months. Following each pause, T Cephei has always "made up time" to reach maximum more or less on schedule.

Minimum brightness is due to occur during October, with the next maximum predicted for late June 2018. If a pause occurs once again in 2018, this will probably kick in at around the end of January.

Files associated with this observation
Like this image
Copyright of all images and other observations submitted to the BAA remains with the owner of the work. Reproduction of work by third parties is expressly forbidden without the consent of the copyright holder. By submitting images to this online gallery, you grant the BAA permission to reproduce them in any of our publications.