Observation by Kevin Gurney: Dynamics of Beta Lyr
Uploaded by
Observer
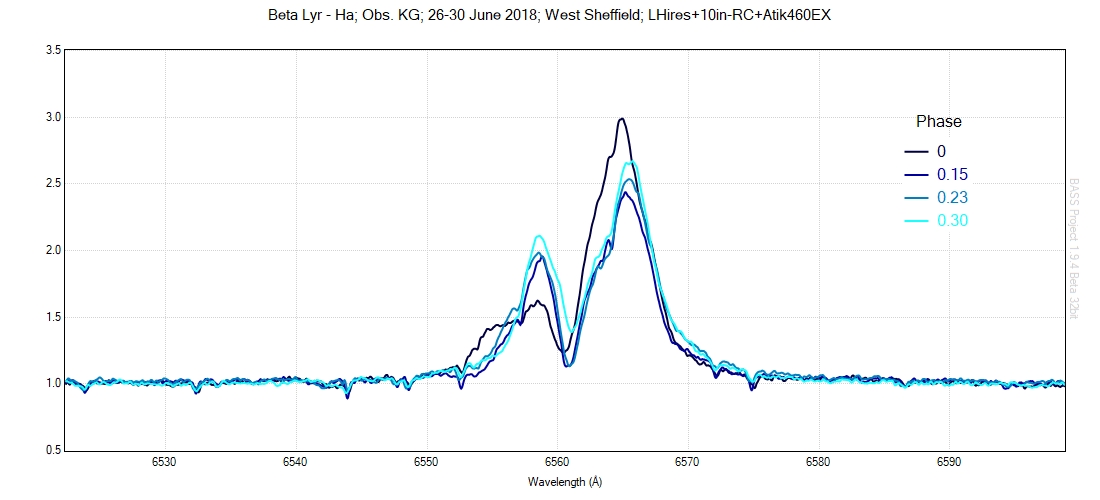
Kevin Gurney
Observed
2018 Jun 27 - 23:13
Uploaded
2018 Aug 02 - 13:41
Objects
Equipment
- Altair Astro 10in RC truss tube
- LHires 2400l/mm
- Atik 460EX
- MESU200 mount
- Prism, Demetra, Isis, BASS
Location
West Sheffield
Target name
Beta Lyr
Title
Dynamics of Beta Lyr
© British Astronomical Association 2026
Registered charity no. 210769
Registered company no. 117572
For more information including contact details,
click here.
Our Terms of Use are here.
Our Privacy Policy is here.
The BAA image gallery was designed and
built by Dominic Ford.
Image gallery software
©
Dominic Ford
2020–2024