Having recently seen a few postings on the Seeliger Effect, I was interested in how long the perceived brightening would last, and what was the shape of the brightening curve. On the internet, I found references to its lasting just a few days around opposition. The effect is attributed to the make-up of the rings – lots of large chunks of material which show bright and shadowed portions for much of the time, until opposition, when the amount of shadow seen falls close to zero, with the sun shining on the rings from directly behind us – a bit like looking at the full moon rather than the terminator.
In the accompanying composite image you can see the apparent brightening of the rings around opposition. You can also see, however, a lot of variability between images, due to seeing, processing and equipment variations, plus the well-known “klutz factor”, that might delude one into seeing what is not there. So I decided to try and use ratios to remove some of this variation from the picture, by comparing ring brightness to the brightness of the yellowish equatorial zone (EZ) of Saturn in each image. My images generally show the A ring and the B ring separately, so I measured the trends in brightness for the two rings.
I downloaded and taught myself the basics of ImageJ software (free!) from the NIH (generally used for measuring images of tissue samples, but with wider applications, including in astronomy – we have also been using it in a school project to measure the position of the terminator on Venus).
I used the software to measure average grey value in the EZ, and the A and B rings, for the 13 images above. I then expressed the values of brightness in A and B as a proportion of the value for the EZ, to reduce the uncontrolled variation between images.
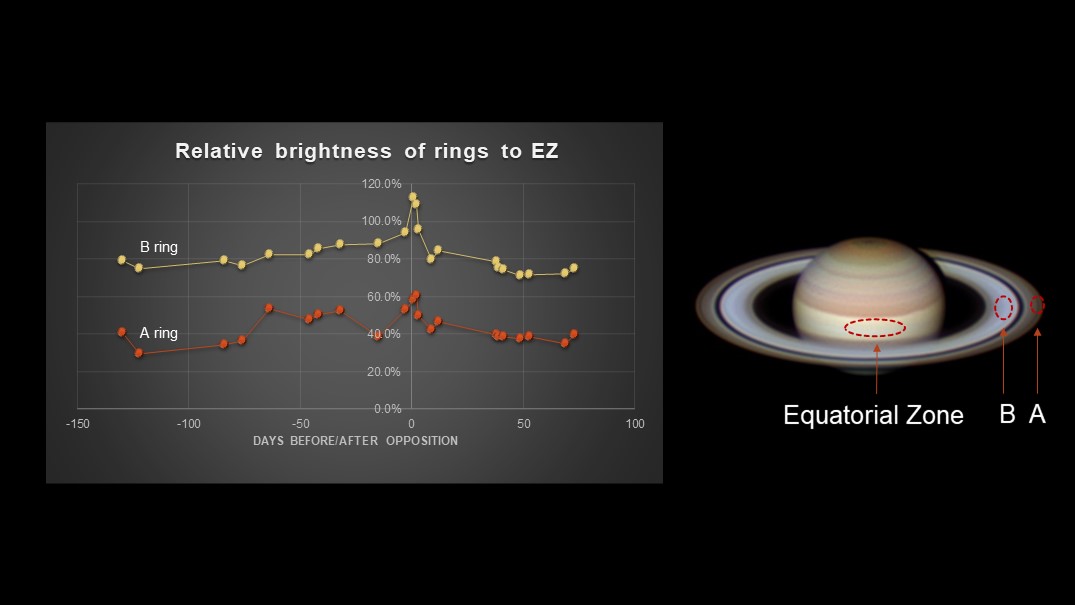
Here are the results, in graph form, with an image of Saturn showing the areas where I was measuring grey value.
You can see that the values for both A and B rings reach a sharp peak around opposition and it does seem that the effect is very short-lived. However, for the B ring, there does seem to be a slow trend upwards as opposition approaches. For the A ring, this is also apparent, but there is much more variation in the trend, probably because of the smaller measurement area. For the B ring, the peak value is reached at 112% brightness compared to the EZ, and for the generally dimmer A ring it is 60%. The values fall precipitously just 2 days after opposition, and continues to fall over subsequent days.
Update: I have replaced the original graph with an updated one running to about 75 days after opposition. The sharp peak in brightness around opposition looks all the more dramatic with this longer run of data.
