2022 April 18
The Doppler Effect in Astronomy
Introduction
How is it we know how fast stars and galaxies are moving towards or away from us? How can we discover a star is double even if the separation of the two stars is too close to be resolved in even the largest of our telescopes? How did we discern the true rotation periods of the planets Mercury and Venus? How can we know how fast a star is rotating? How was the first planet orbiting a star outside the Solar System discovered? One of the greatest astronomical discoveries of the twentieth century was the expansion of the universe, how was that uncovered?
The answer to all these questions is the Doppler Effect.
In this short tutorial we will discuss the “Doppler Effect” and some of the many uses it has in astronomy. As we shall see it has proven to be a very powerful tool for measuring velocities in astronomy.
The Doppler Effect
The Doppler Effect is a well-known and quite common phenomenon in everyday life but it is perhaps worth revisiting it before considering its astronomical effects.
Listening, for example, to an ambulance or police car approaching at speed and then receding, you will probably have noticed that the siren sound is different in these two cases with a sharp change in pitch as it passes. More specifically the siren has a higher note approaching you and a lower one as it recedes. This is the Doppler Effect.
What is happening is that as the car approaches you its motion compresses the siren’s sound wave, moving the crests and troughs closer together and so increasing the sound’s frequency. This changes the pitch to a higher one. When receding the crests and troughs are spread further apart and lower notes result (Figure 2).
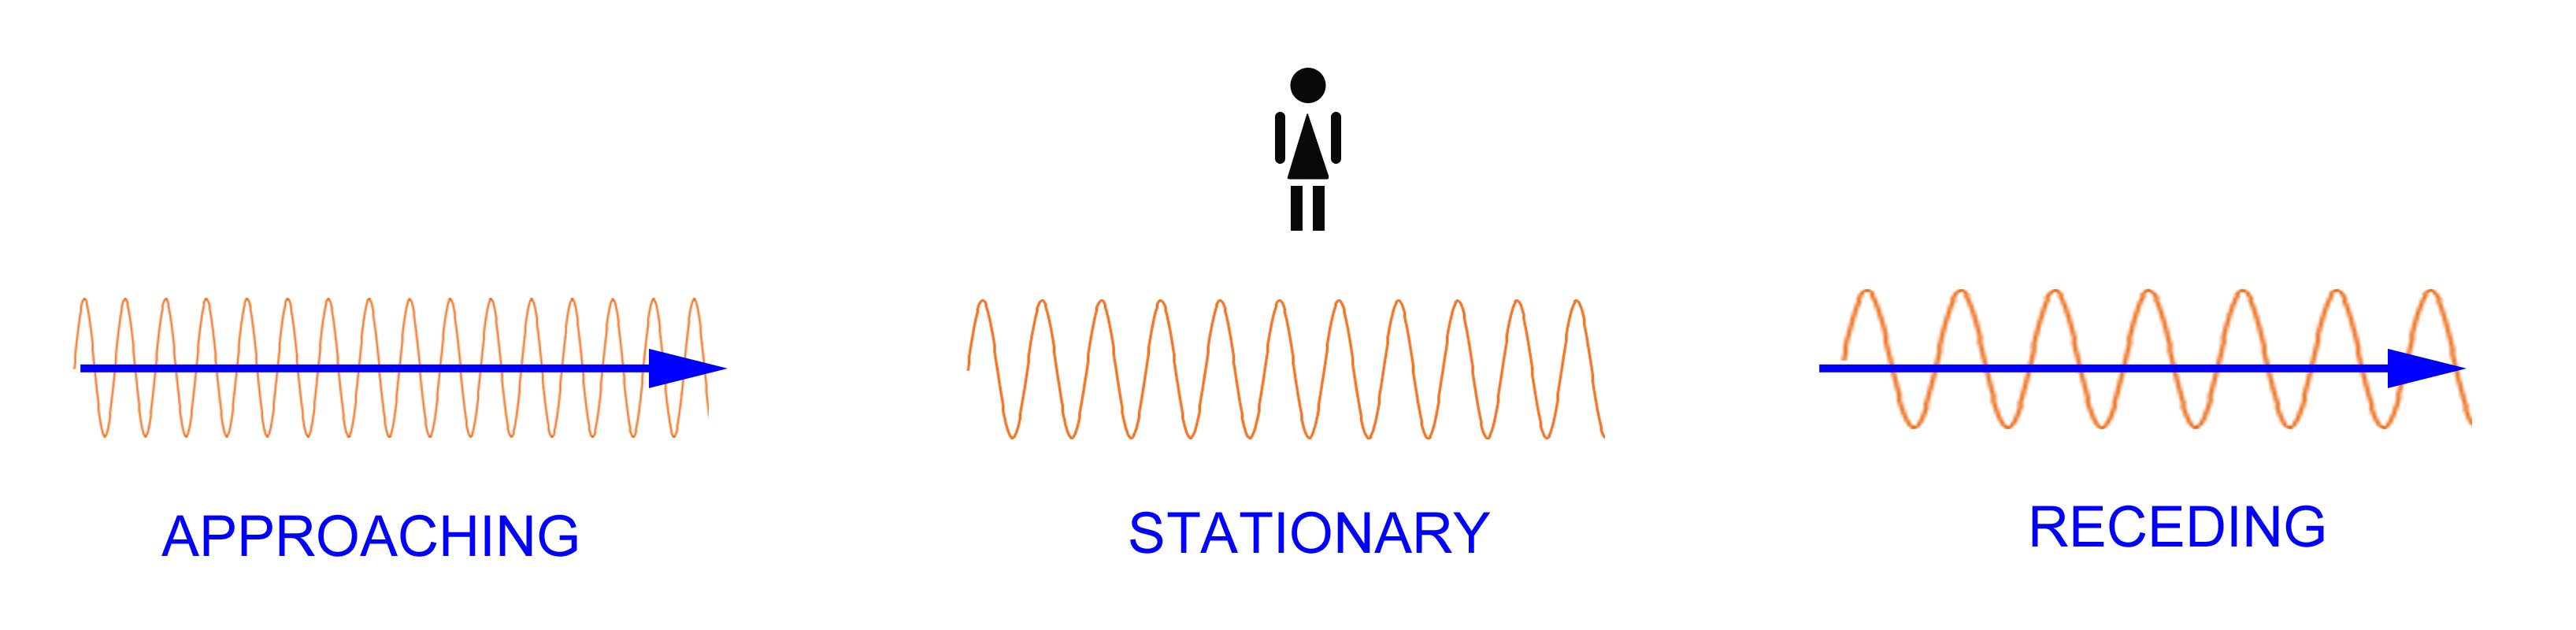
This is the Doppler Effect.
Light and the Doppler Effect
The Doppler Effect will occur with any wave phenomena including electromagnetic radiation such as visible light. Here, when a body is approaching, its wavelength shortens and the colour of the light moves towards the blue and this is logically enough described as a blueshift. When it is receding, the wavelength increases and the colour shifts towards the red. This is the famous redshift.
Detecting Doppler Shifts
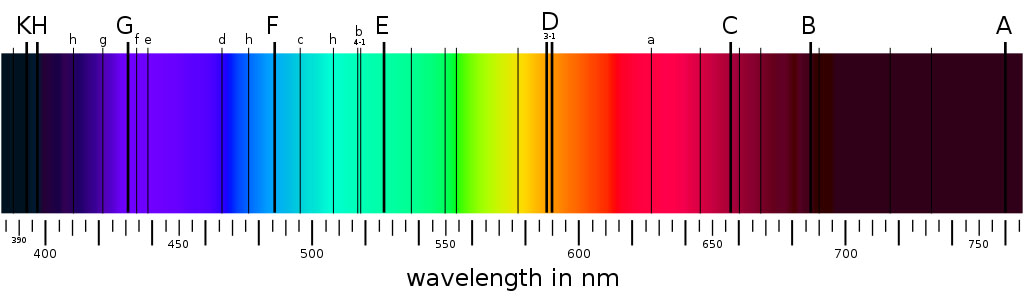
It is all very well saying an object becomes redder or bluer but how is that change in colour actually measured precisely? As in so many areas of astronomy, we need to spread a star or planet’s light out into a spectrum with red at one end through to blue at the other. Generally speaking, when we do this, we find that the spectrum is crossed with dark lines. These are the ‘fingerprints’ of the elements in the star emitting the light (Figure 3).
The key point here is that when an object is stationary (technically described as being ‘at rest’), these lines always appear at the same wavelengths. However, when the object is moving toward or away from us the spectral lines will be shifted to different wavelengths by the Doppler effect. Consequently, by measuring the new wavelength that the line now appears at and comparing that to the rest wavelength we can accurately measure the Doppler shift and hence the object’s velocity towards or away from us.
Let’s define Doppler shift a in a more formal manner.
Doppler shift = (observed wavelength – rest wavelength) / rest wavelength.
With the Doppler shift being caused by an object’s motion it is no surprise that there is an equation linking the two. For electromagnetic radiation such as light the formula is:
Velocity = Doppler shift * speed of light (roughly 300,000 km/sec).
Perhaps a worked example will be useful.
Hydrogen, the most common element in the universe has amongst others an emission at 656.3 nanometres (nm). If we observe a certain galaxy, we might find this has shifted to 660.0nm, an amount of 3.7nm. Therefore, the Doppler shift is 3.7/656.3 = 0.006. Its recessional velocity is then approximately 0.006 * 300,000 = 1800 km/sec away from us.
Let us now consider some of the many uses of the Doppler Effect in astronomy.
Stellar Motions
Let us think for a moment about a star moving through space. As seen from Earth, if it is not too far away and moving reasonably quickly, we may be able detect a slight motion across the sky of only a fraction of arc second per year. This is known as its Proper Motion. Providing we know the star’s distance we can then calculate an equivalent velocity. This tells us something about the star’s true motion but not everything. The problem is that we are only seeing it moving at right angles to our line of sight, we cannot discern directly whether it is moving towards or away from us. Is a star that appears only to move very slightly actually due to a very low velocity or is its motion mostly directly towards or away from us with very little across our line of sight?
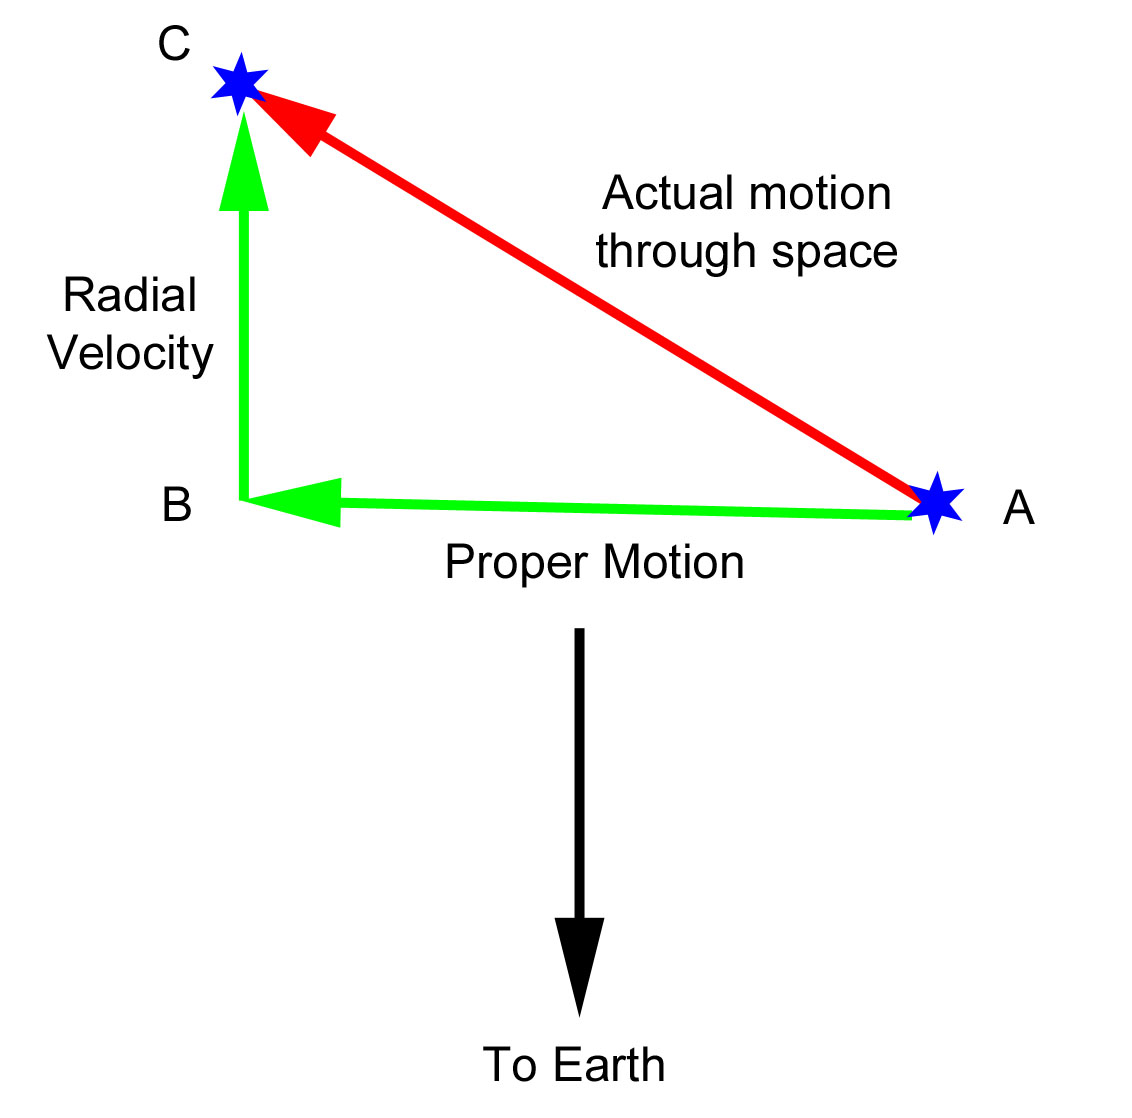
Obviously, the Doppler Effect comes to our rescue here. By carefully measuring the wavelength of the spectral lines we can work out its speed towards or away from us. This is known as its Radial motion. Combine the radial motion with the proper motion and it is possible to calculate the star’s true velocity through space. This leads to an understanding of how some stars move in ‘streams’, how parts of the galaxy rotate, even to the detection of runaway stars thrown out of stellar systems by supernova explosions.
Double Stars
Many stars that at first appear single are actually double or even triple. Some of these are just chance alignments, with the stars involved actually at very different distances from us. The majority of multiple stars however are actually close to each other and are gravitationally bound. This means they orbit around their common centre of gravity in the same way that the Earth and Moon do.
Many doubles are wide enough to be split and monitored in ordinary telescopes. A good question to ask is will there be doubles that are so close that it is impossible to split them in even the largest telescopes? The answer of course is yes, but how do we know this for certain?
In figure 5 we have a diagram of the components of a double star at various points in the orbit. For the purposes of this example the orbit is edge on as seen from Earth. In Figure 5A the two stars are moving at right angles to our line of sight and are therefore neither approaching nor receding from us. A quarter of an orbit later (Figure 5B) one star is now approaching and one receding. A further quarter turn (Figure 5C) and once again there is no motion towards or away from us. Finally in Figure 5D we again have one star receding and one approaching.
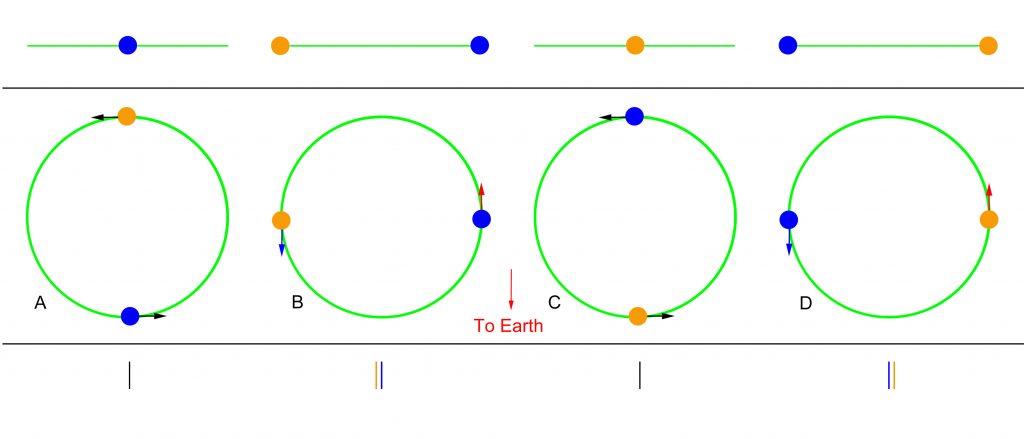
How does the Doppler Effect work here? Consider the stars’ motions in 5A and 5C. Here there is no motion towards or away from us, no scope for the Doppler Effect and the spectral lines will appear as they normally would. However, in 5B the orange star is approaching and will have a blueshift while the blue one is receding and will have a redshift. As a result, each line will have split into two and appear double. The same principle applies in 5D except that the star that was blue shifted now has a red shift and vice versa. So, when observing such a star we will see the lines alternate from single to double to single then double again and finally back to single to start the sequence once more. From this we know how long the stars take to orbit each other. Such stars are known as Spectroscopic Binaries.
Some stars are so close that the lines cannot be separated. However, the profile of the single line may change. If one star is brighter than the other then the bright component will alternate between the blue and red sides of the line changing its profile.
There is one very important limitation to this technique. It is dependent on the angle the star’s orbit makes with respect to the Earth. Consider once again Figure 5. In the top panel the orbit is edge on and obviously the stars will approach and recede from us. However, if in the middle panel we were actually viewing the orbit face on then there would be no motion towards or away from us and hence no Doppler shift or doubling of the lines. The binary would remain undetectable. Of course, the majority of binaries are neither exactly edge on nor face on but somewhere in between. As a result, the effect we see is usually only part of the stars’ true orbital velocity, not the full amount.
Stellar Rotations
The Doppler Effect can also be used in certain circumstances to determine how fast a star is rotating.
As with Spectroscopic Binaries the angle of viewing is all important. If the axis of rotation was directed straight at us, then neither limb would be approaching or receding. Consequently, there would be no Doppler Effect and therefore no line widening. The majority of stars will lie somewhere in between these two extremes so the apparent rotation speed is almost always less than the actual one.
Care has to be taken in the interpretation of this widening as there are a number of other processes that can mimic the effect.
The rotation periods of the inner planets
Up until the middle of the 20th century the rotation periods (length of their day) of the planets Mercury and Venus were not accurately known. The Doppler Effect came to the rescue here as well. In this case radar was used. Radio telescopes were used to beam signals at the planets, the signal bounced off and returned to Earth where it was detected.
Careful analysis showed that the returning signal was ‘smeared’ in wavelength. The principle is exactly the same as used in detecting stellar rotations except here we are using reflected radio waves sent from Earth rather than the object’s own radiation.
These experiments gave surprising results. For Mercury the answer was 58.6 days when it had previously been believed to be 88 days. For Venus the answer was even more surprising. Because the surface of Venus is completely shrouded in clouds it had never been seen and it needed this radar approach to detect the surface rotation. The result was 243 days in the wrong direction. Venus, it turned out, has a day longer than its year!
Exoplanets
Planets orbiting stars other than our Sun, exoplanets, can also be discovered by means of the Doppler Effect. Indeed, the very first exoplanet was discovered by this method around the naked eye star 51 Pegasi.
How does this work? After all exoplanets have no light of their own, shining only by light reflected by their parent star and thus are extremely faint. If the planet is sufficiently massive it will produce a noticeable tug on the star as they orbit around their common centre of gravity. The spectral lines of the star will therefore alternate between a very small blueshift and an equally small red one. The process is basically the same as with spectroscopic binaries except in this instance one of the bodies involved is effectively dark and adds no lines to the spectrum. So instead of a doubling of the lines there is a single line shifting back and forth.
Rotation of Galaxies and the discovery of Dark Matter
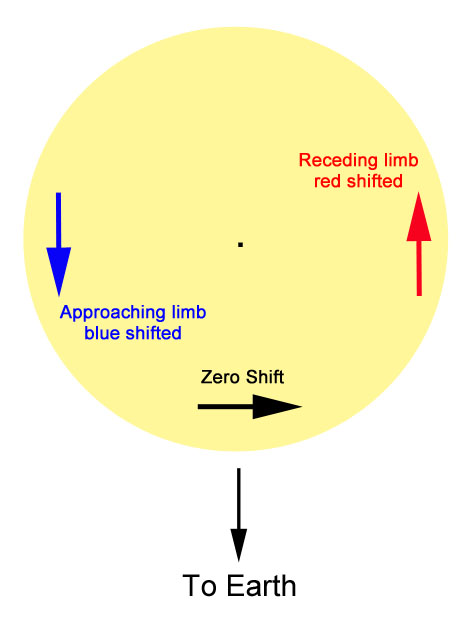
If we turn our spectroscopes onto distant galaxies, we see two effects due to the Doppler Effect. Firstly, most galaxies appear to be receding with the expanding Universe, much more about this in a future tutorial. Secondly the individual galaxies are rotating, there is nothing surprising in this in itself and it is measurable using the Doppler Effect. One side of the galaxy is approaching us and will be blue shifted relative to the galaxy’s intrinsic motion, the other receding and will be likewise red shifted.
The key thing is that it is possible to measure the speed of rotation at various distances from the centre of the galaxy. Basically, the Doppler Effect will change as the measurement proceeds from centre to rim.
Rather than the rotation speed dropping off in a predictable way from centre to edge as expected, it was found there was not very much reduction in velocity at all. The best explanation for this is that of a hypothetical ‘Dark Matter’ that exists beyond the core of the galaxy and impacts the rotation speed. While this was not the first indication of the existence of Dark Matter it is a very strong indicator indeed. Since Dark Matter is estimated to comprise 26.5% of the entire universe this was a very significant discovery.
Conclusion
The Doppler Effect has been instrumental in many of the discoveries of modern astronomy and continues in importance to this day. Probably its greatest contribution was to the discovery of the expanding universe. When we turn our spectroscopes towards distant galaxies, we find they are all receding from us. The story of this discovery and the expansion of the universe itself are the subject of the next tutorial.
Teaser image: A source of light waves moving to the right, relative to observers, with velocity 0.7c. The frequency is higher for observers on the right, and lower for observers on the left. Image by TxAlien via Wikimedia Commons.
| The British Astronomical Association supports amateur astronomers around the UK and the rest of the world. Find out more about the BAA or join us. |