2015-16, Report No.10: Anticipating the last views from Earth and first views from Juno
Anticipating the last views from Earth and first views from Juno
As ground-based observers are losing Jupiter in the evening twilight, Juno is coming in for its first operational perijove this Saturday, August 27. Here we present the last ground-based colour map of the apparition, and a predictive map for the Aug.27 encounter. The main change since our last report in June is that the convective storms have reappeared west of the Great Red Spot; hence, the South Equatorial Belt is not likely to fade in the next few months.
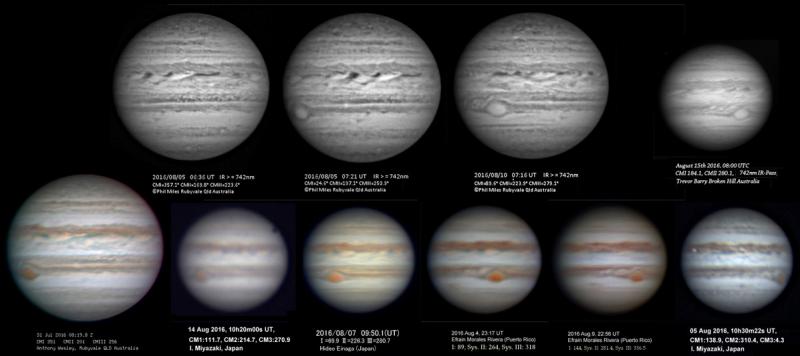
As the planet slips behind the sun, it is rapidly becoming unobservable from the northern hemisphere. Images were still taken up to early August by Antonio Lasala, Efrain Morales Rivera, Tiziano Olivetti, and several Japanese observers posting on ALPO-Japan – most notably, Hideo Einaga, who is one of Japan’s most accomplished and assiduous observers, and also produces his own maps. Still persevering in mid-August are Isao Miyazaki (on Okinawa) and three Australians: Anthony Wesley, Trevor Barry, and Phil Miles. They take images before sunset through near-infrared filters, for optimum contrast and sharpness in the afternoon sky. Maps from such images have been posted by Marco Vedovato, and some other images – Miles’s especially sharp ones in infrared, and the best recent ones in colour – are compiled in Figure 1. The colour images show obvious white spots following the GRS, representing a renewal of the normal convective activity, while the GRS itself is still intensely red.
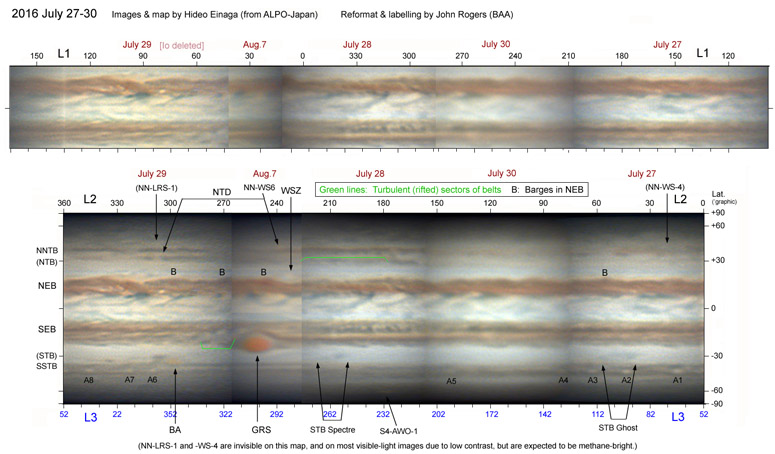
The last full-colour map of the apparition was produced by Hideo Einaga from his own images taken on July 27-30, and is shown in Figure 2 (in L2 and L3). As a narrow longitude range including the GRS was not well shown, I have filled that range with a sector of Einaga’s map from Aug.7, adjusted to the July longitudes. I have also compiled a map of the equatorial region in L1 from Einaga’s originals.
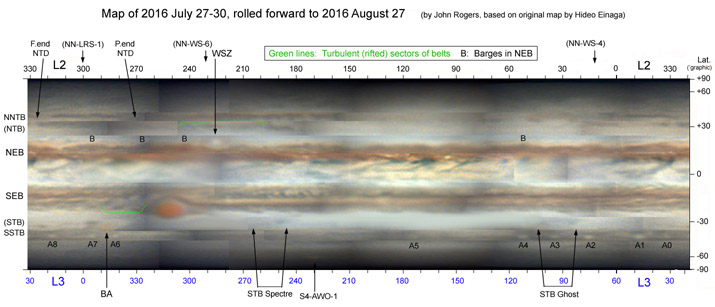
In order to predict what may be visible to Juno on Aug.27, in Figure 3 I have ‘rolled forward’ Figure 2 by 30 days using recent drift rates. (Details are explained in an Appendix at the end this item.) Of course, this is only intended to represent the estimated positions of the major features; minor features will have changed during the month. Juno’s perijove will be at L1 = 33, L2 = 36, L3 = 96. The most notable feature below its track will be the STB Ghost, a long-lived cyclonic circulation.
Unlabelled versions of the maps can be provided on request. For background information and details of all the features shown in these maps, please see our previous report (no.9), at: https://www.britastro.org/node/7741.
–John Rogers
2016 August 24
__________________________________________
Here are half-scale versions of the figures. Full-size versions can be down-loaded from the links below.


__________________________________________
Full-size figures:
Fig2_Map_2016jul27-30_eJ_Einaga_v5_labeld.jpg
Fig3_Map_2016jul27-30_rolled-to-Aug27_N-up-labeld.jpg
__________________________________________
Appendix: Details of the rolled-forward map:
The mid-latitude domains have been shifted east or west according to recent measurements from the JUPOS team; the three greatest anticyclonic ovals (GRS, BA, WSZ) were adjusted separately. Higher latitudes (>40ºN and >42ºS) were arbitrarily assigned constant L3 (DL2 = -8º/month), because the ovals in these domains undergo frequent large unpredictable changes in drift rates, and are mostly invisible on this map anyway due to low contrast and/or resolution. Nevertheless, estimated positions are given for the ovals in the N.N. Temperate domain (LRS-1 and WS-6) as they will be bright in methane-band images. For the equatorial region (12ºN to 6ºS), the L1 map from July was used, shifted +13º which is the recent mean drift rate; however the features may have changed considerably in this time. The map shows many artefactual boundaries between shifted sectors and between original images, even though I have minimised some of them cosmetically.
Adopted drift rates were as follows (degrees longitude per 30 days):
DL2 DL3
N. Temperate (inc. NTD) +21 +29
N. Tropical (exc. WSZ) -3 +5
WSZ -8 0
N. Equatorial DL1 = +13
S. Tropical (exc.GRS) +10 +18
GRS and SEB f. it 0* +8
S. Temperate (Ghost & Spectre) -16 -8
Oval BA -11 -3
S.S. Temperate -28 -20
*The mean GRS drift rate is still DL2 = +1.9 deg/month, but due to the phase of the 90-day oscillation it remains at L2 = 251 during August.
________________________________________________
| The British Astronomical Association supports amateur astronomers around the UK and the rest of the world. Find out more about the BAA or join us. |
