› Forums › Spectroscopy › First spectra post Alpy workshop! › gnuplot
Hi Steve,
gnuplot seems to be working ok for me with ISIS 5.7.0. (see attached quick example)
Do you have auto scale unchecked on the single plot?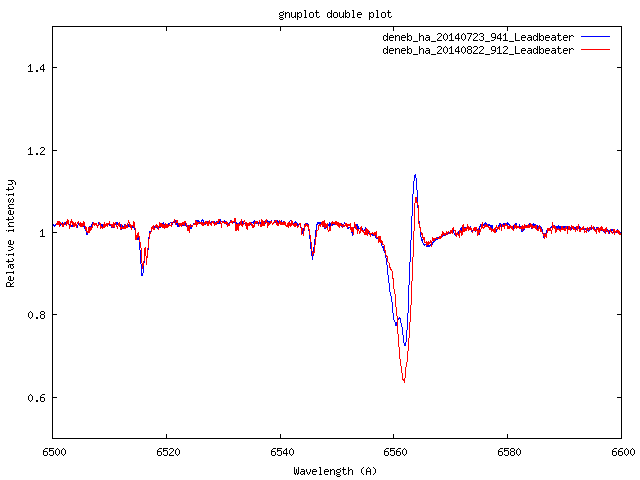
The Y scales cannot be set independently in the double plot so it just plots the spectra as they have been scaled in processing. Your two spectra appear to be scaled to1 near H alpha which is where they match. The hotter of the two stars (eps Aur) then rises faster towards the blue end as would be expected) You could try rescaling them at 5000A say using the “profile” “normalize” function when they will cross closer to the middle of the spectrum.
There are more sophisticated plotting tools around though. For example Tim Lester has recently posted one he is developing on the ARAS forum
http://www.spectro-aras.com/forum/viewtopic.php?f=8&t=1596
Robin