› Forums › Meteors › High resolution meteor spectrum. › Hi,
Hi,
Here’s a calibrated graph of the spectrum. Had a few headaches with this one as the spectrum isn’t the third order, it’s the second order. A bit of confusion with the image scale after 12+ years of working with spectra from WATECS…
A few “lines”, marked with an * are stellar artifacts and noisy pixels not real lines.
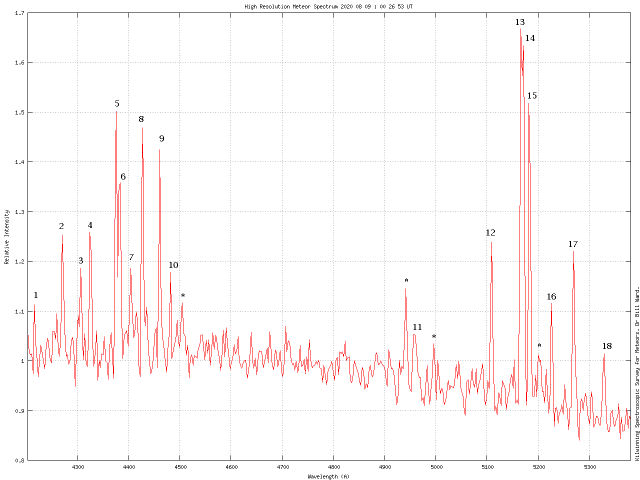
and here’s a list of list of catalogue lines closest to the “barycentre” of the spectrum line (as it’s called in VisualSpec)
Line Wavelength (nm) Element
1: 421.618 Fe I
2: 427.176 Fe I
3: 430.790 Fe I
4: 432.576 Fe I
5: 437.593 Fe I
6: 438.355 Fe I
7: 440.475 Fe I
8: 442.730 Fe I
9: 446.165 Fe I
10: 448.113 Mg II
11: 495.760 Fe I
12: 511.040 Fe I
13: 516.732 Mg I (Probable blend with 516.749nm Fe I)
14: 517.268 Mg I (Probable blend with 517.160nm Fe I)
15: 518.360 Mg I
16: 522.715 Fe I
17: 526.954 Fe I
18: 532.830 Fe I
If the spectrum had been a bit brighter, or shifted to either side a bit, perhaps other lines would have been observed. However as is, it looks like a simple composition of just iron, magnesium and sodium.
Interesting because it is rather un-interesting!
Cheers,
Bill.