
› Forums › Variable Stars › Variable Star Section Circular for September 2026 (number 209)
- This topic has 17 replies, 4 voices, and was last updated 1 month, 1 week ago by
 Jeremy Shears.
-
AuthorPosts
-
2 September 2026 at 7:28 am #642662
 Jeremy ShearsParticipant
The September edition of the BAA Variable Star Section Circular is now available for download here.
I do hope you enjoy reading the articles. Many thanks, as ever, to all our authors and to our Editor, Gary Poyner.
As you will no doubt be aware, we have recently been enjoying 3 northerly novae. These are shown on the front cover of the Circular
Please do consider writing something for our next circular. Please send contributions to Gary.
Clear skies!
Jeremy Shears
Director, VSS2 September 2026 at 9:28 am #642716 Mike HarlowParticipant
Very nice article by Hugh Allen on U Cephei. It was on my list for the winter but no point now!!! (Only joking).
Yes, three very interesting novae, but no mention of my objective prism spectra. I’m obviously not famous enough?
It is noted that there are few spectra of Nova Tauri (David Cejudo has now made lots more). I’ve made one on every clear morning starting on 12th August. Not calibrated but still spectra. See the Gallery and Forum posts for details.
Mike.2 September 2026 at 10:23 am #642717Jeremy ShearsParticipantMike,
as I have commented before, you are always welcome to write something up for the Circular tor Journal.
On a broader point, the BAA Gallery is a place to present ones images, and it is good that you do that, but it it not the place to submit observations for analysis because it is not an observational archive. The place to submit VSS observations is the Photometry Database or the Spectroscopy Database. Submitting to these ensures the data are archived properly and available to all.
I can also add that VSS Circular articles (like JBAA papers) appear on the NASA ADS, where they are also available to all. Contributions welcome.
Jeremy
2 September 2026 at 9:23 pm #642724 Robin LeadbeaterParticipant
Hi Mike,
The spectroscopy database is not designed to take spectrum images and though digitisation is straightforward using freely available software, the precise wavelength calibration of objective prism spectra is tricky due to the lack of a reference point and very non linear dispersion. It could still probably be achieved though. Do I remember correctly that you had a previous setup which allows some light from the star to bypass the prism, allowing an image of the star to be produced? This could be used as a reference point for wavelength calibration. If you are interested I could take a look and see what could be done. (The database does allow an image to accompany the digitised spectrum so the original spectrum image could be archived alongside the calibrated digitised version)
Cheers
Robin3 September 2026 at 8:53 am #642743 Gary PoynerParticipant
Just to reiterate Jeremy’s point about spectra. I only check the spectroscopy database for reference to spectra for an object mentioned in the VSSC.
Gary
3 September 2026 at 3:21 pm #642748Robin LeadbeaterParticipantThe spectroscopy database is not designed to take spectrum images and though digitisation is straightforward using freely available software
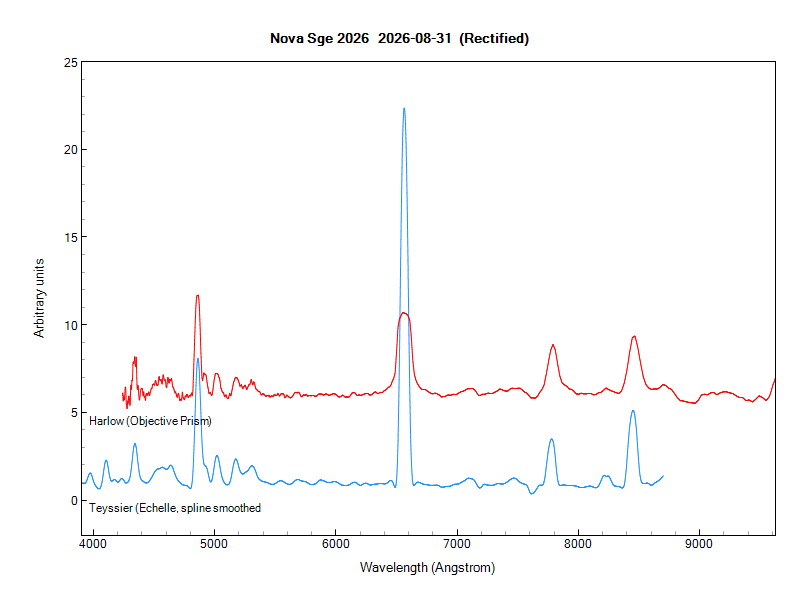
Here is a “quick and dirty” digitised spectrum off the jpg of the observation 2026-08-31 compared with one from the same night by Francois Teyssier from the ARAS database at much higher resolution so spline smoothed for this comparison.
For wavelength calibration I used a 4th order polynomial based on 8 identified emission lines and since I did not have a reference star for flux calibration, I rectified (flattened) the spectra.
Apart for the strength of the H alpha line which was saturated in the jpg image, the agreement looks good.Cheers
Robin-
This reply was modified 1 month, 1 week ago by
 Robin Leadbeater.
Attachments:
3 September 2026 at 4:17 pm #642757Jeremy ShearsParticipantThe spectroscopy database is not designed to take spectrum images and though digitisation is straightforward using freely available software
Here is a “quick and dirty” digitised spectrum off the jpg of the observation 2026-08-31 compared with one from the same night by Francois Teyssier from the ARAS database at much higher resolution so spline smoothed for this comparison.
For wavelength calibration I used a 4th order polynomial based on 8 identified emission lines and since I did not have a reference star for flux calibration, I rectified (flattened) the spectra.
Apart for the strength of the H alpha line which was saturated in the jpg image, the agreement looks good.Cheers
RobinNice work Robin. Is that a P Cyg profile in the H_alpha line in the Tessier spectrum but not from the prism?
3 September 2026 at 5:52 pm #642762Robin LeadbeaterParticipantIs that a P Cyg profile in the H_alpha line in the Tessier spectrum but not from the prism?
Hi Jeremy,
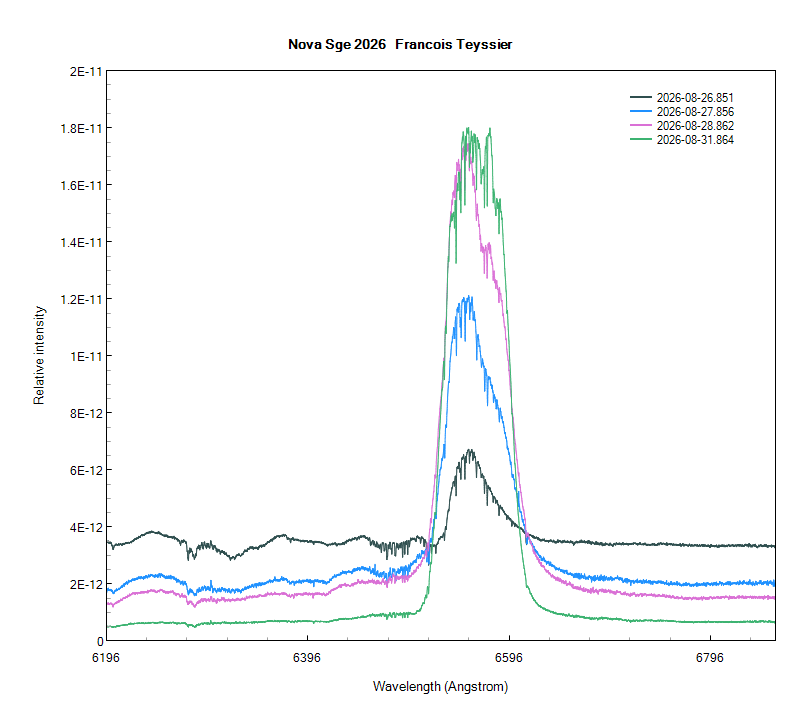
I think it is probably an artefact from the spline fit I used to reduce the resolution down to match Mike’s resolution. There was a P Cygni profile at ~1500km/s in early spectra 25/26 Aug but it was soon engulfed by the emission. Here is H alpha in Francois’ spectra at full resolution. You can see the P Cygni profile in the earliest spectrum (and in my low resolution spectrum from 25th) but not after (The narrow lines are telluric water lines)
Cheers
Robin3 September 2026 at 7:46 pm #642767Jeremy ShearsParticipantIs that a P Cyg profile in the H_alpha line in the Tessier spectrum but not from the prism?
Hi Jeremy,
I think it is probably an artefact from the spline fit I used to reduce the resolution down to match Mike’s resolution. There was a P Cygni profile at ~1500km/s in early spectra 25/26 Aug but it was soon engulfed by the emission. Here is H alpha in Francois’ spectra at full resolution. You can see the P Cygni profile in the earliest spectrum (and in my low resolution spectrum from 25th) but not after (The narrow lines are telluric water lines)
Cheers
RobinHello Robin,
ah, that makes sense. Thank you. Yes, I noticed the P Cyg profile in your earlier spectrum.
Would Mike’s prism have sufficient resolution to see the signal when present? Or a Star Analyser, for that matter? – I seem to recall you showed it with P Cyg itself, but I was wondering about novae.
Go well!
Jeremy3 September 2026 at 11:11 pm #642770Robin LeadbeaterParticipantHi Jeremy,
There is indeed an early Star Analyser spectrum of this Nova posted on “Cloudy Nights” in which the P Cygni profile at H alpha is resolved
Note sure if it can be picked up in Mike’s early spectrum but I will take a look (The resolution in prism spectra is highest at the blue end where the dispersion is greatest)
Cheers
Robin3 September 2026 at 11:19 pm #642771Robin LeadbeaterParticipantNot sure if it can be picked up in Mike’s early spectrum
Yes Mike reported the P Cygni profile was visible, most clearly in H beta
https://britastro.org/forums/topic/likely-bright-nova-in-sagitta#post-642596Cheers
Robin-
This reply was modified 1 month, 1 week ago by Robin Leadbeater.
4 September 2026 at 6:21 am #642773Jeremy ShearsParticipantHi Jeremy,
There is indeed an early Star Analyser spectrum of this Nova posted on “Cloudy Nights” in which the P Cygni profile at H alpha is resolved
Note sure if it can be picked up in Mike’s early spectrum but I will take a look (The resolution in prism spectra is highest at the blue end where the dispersion is greatest)
Cheers
RobinThanks Robin. Good to see.
4 September 2026 at 7:33 am #642774Mike HarlowParticipantI did post to this forum on 2nd September, which prompted Gary’s reply, but my post disappeared!
Anyway, thanks for all your replies/comments, I will work towards calibrating my spectra so they are suitable for the database.
My one question is: What is the best software to use? I have used VisualSpec in the past but is there a better option.
And one final comment, Nigel Evans has derived the dispersion equation for my system so I can calculate the wavelength for any pixel value in the spectrum. Very useful, especially for planetary nebulae where there is an image rather than a line.4 September 2026 at 2:33 pm #642775Robin LeadbeaterParticipantNigel Evans has derived the dispersion equation for my system so I can calculate the wavelength for any pixel value in the spectrum.
Hi Mike,
I used a mix of Visual Spec and ISIS to process your spectrum (VSpec to remove the sky background and digitise, ISIS to derive the dispersion equation and rectify) See
https://britastro.org/forums/topic/variable-star-section-circular-for-september-2026-number-209#post-642748
but there are other packages around which could do this eg RSpec, BASS and others. The steps are the same and essentially those I describe here
https://britastro.org/document_folder/baa-document-store/past-talks/spectroscopy-workshop-at-the-nlo-oct-2015
specifically “Low resolution slitless spectroscopy”You still need a reference point in the spectrum to be able to do an absolute wavelength calibration though, hence my question about the possibility of including an image of the star in the same image.
We are off topic here though so we could either continue this in spectroscopy section of the forum or off line if you like
Cheers
Robin-
This reply was modified 1 month, 1 week ago by Robin Leadbeater.
-
This reply was modified 1 month, 1 week ago by Robin Leadbeater.
-
This reply was modified 1 month, 1 week ago by Robin Leadbeater.
4 September 2026 at 2:47 pm #642779Robin LeadbeaterParticipantNote that the forum software incorrectly attributed my quote here to Gary for some reason (I have seen this on occasion before and could result in some confusion and dispute !)
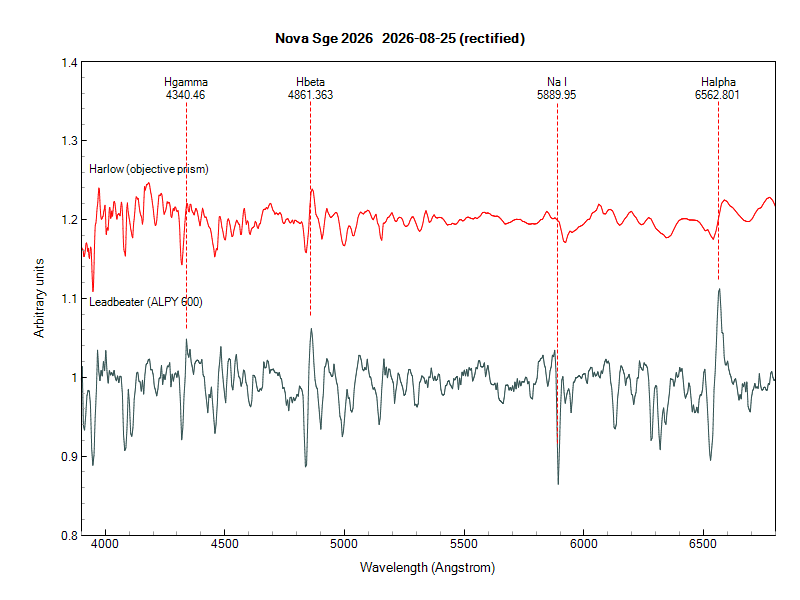
4 September 2026 at 6:20 pm #642781Robin LeadbeaterParticipantJust to round this off, here is the processed version of Mike’s early spectrum image taken on 2026-08-25 compared with mine for the same night. They are qualitatively similar with the P Cygni profiles in H alpha, Beta visible at this stage can be seen in both spectra along with various other lines including FeII. The objective prism resolution approaches that of the ALPY at the blue end but is significantly lower above 5500A where the non linear dispersion compresses the scale in the prism spectrum. (Note the Y scale, these features are quite weak)
Cheers
RobinAttachments:
4 September 2026 at 7:41 pm #642783Jeremy ShearsParticipantJust to round this off, here is the processed version of Mike’s early spectrum image taken on 2026-08-25 compared with mine for the same night. They are qualitatively similar with the P Cygni profiles in H alpha, Beta visible at this stage can be seen in both spectra along with various other lines including FeII. The objective prism resolution approaches that of the ALPY at the blue end but is significantly lower above 5500A where the non linear dispersion compresses the scale in the prism spectrum. (Note the Y scale, these features are quite weak)
Cheers
RobinThanks Robin. Interesting to see.
-
This reply was modified 1 month, 1 week ago by
-
AuthorPosts
- You must be logged in to reply to this topic.