A comparison of BAA Solar Section white-light measurements
2021 February 2
Introduction
Each month, over 50 BAA solar observers submit their daily observations to the Solar Section. These are used to form the activity summary tables in the Section’s monthly Newsletter and in the Journal Solar Section ‘Notes & News’ reports. White-light measurements take the form of daily counts of one or more of the following: the number of sunspot groups (g), the sunspot number (R = 10g + f where f is the number of sunspots) and the quality number (Q). The number of groups is for the whole disc, which may also be separated into the northern and southern hemispheres. These daily counts are averaged for all observers and then over all days of each month to give the mean daily frequency (MDF) values that are used to monitor the long-term sunspot activity of the Sun. The majority of observers report g (with an average of 49 during the 10 years since the start of Solar Cycle 24 in 2009); slightly fewer also report R (43) while fewer observers also report Q (11). An easy online form is available for the submission of white-light and hydrogen-alpha daily measurements.1
After showing the variation in the number of BAA sunspot groups during Cycle 24, this paper performs a comparison of solar activity over the cycle, based on each of the BAA g, R and Q measurements. This is to assess whether there are any differences in the measured activity depending on which type of measurement is made by the observer. The comparison is performed by (i) plotting g against R, and Q against R, together with a linear fit and (ii) plotting the ratio of R/g and R/Q for each month to assess if there are any differences depending on the time within the solar cycle. The paper then continues by examining outlier months in the g-against-R plot, which have more or fewer sunspots than expected compared to the linear fit. Finally, the paper compares the monthly International Sunspot Number with the BAA sunspot number during Cycle 24.
Cycle 24
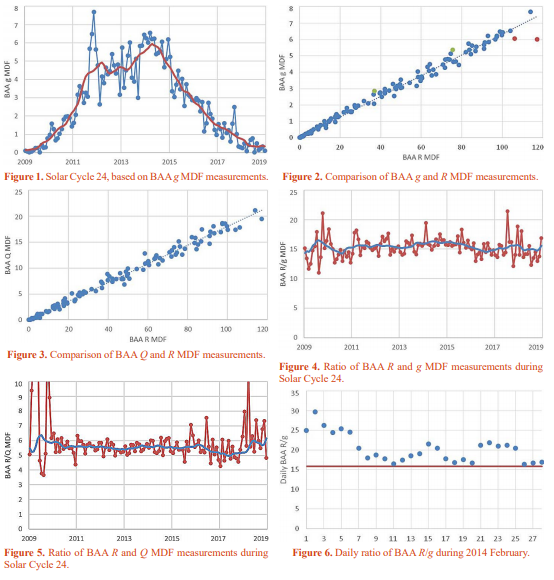
After a prolonged solar minimum, Cycle 24 began in 2009 and peaked in early 2012 and mid-2014. This is shown in Figure 1, which is based on BAA Solar Section sunspot group observations (the red curve is the average over 13 months). In comparison with previous cycles, Cycle 24 was the smallest since Cycle 14 which peaked in 1906. Although not unique, the double peak of Cycle 24 was quite pronounced and was the result of differing activity between the northern and southern solar hemispheres. Solar minimum was expected to occur during 2019.
Comparison of BAA g, R and Q measurements
To compare g, R and Q, the g and Q MDFs have been plotted against the R MDF for each month during Cycle 24 (the 10 years from 2009). Q is based on the type of sunspot group; the simplest groups consisting of one or more sunspots without penumbra have a low Q number, while the most complex groups have a higher Q number.2 Figure 2 shows the plot of g against R together with a linear fit between the two MDFs (assuming an intercept at the origin), which gives g = 0.0633R or R = 15.80g and the r-squared goodness of fit as 0.986. Figure 3 shows a similar plot for Q against R where the linear fit gives Q = 0.1801R, or R = 5.55Q, and an r-squared value of 0.986. In both plots, as indicated by the r-squared value being close to one, there is a good relationship between g, Q and R.
How do the BAA g, R and Q MDFs compare throughout Cycle 24? Figure 4 shows the ratio of R and g MDFs during the cycle, together with a ratio of the 13-month smoothed R and g MDFs (shown in blue). Figure 5 shows a similar plot for R and Q MDFs. In both cases, the ratio shows more variability during solar minimum than during the rise, peak and fall parts of the solar cycle. This is particularly the case for the ratio of R and Q, where Q can have very small values during the minimum parts of the cycle. Within the main part of the cycle, the ratios do not significantly change although some variability is expected. This is due to the changing nature of the types of sunspot group seen during the cycle, with less complex groups seen during the rise/peak and more complex groups seen during the latter part of the peak and the fall of the cycle.
(Login or click above to view the full illustrated article in PDF format)
https://britastro.org/wp-content/uploads/2021/02/fig1.PNG
https://britastro.org/wp-content/uploads/2021/02/fig1.PNG
https://britastro.org/wp-content/uploads/2021/02/fig1.PNG
https://britastro.org/wp-content/uploads/2021/02/fig1.PNG
https://britastro.org/wp-content/uploads/2021/02/fig1.PNG
https://britastro.org/wp-content/uploads/2021/02/fig1.PNG
https://britastro.org/wp-content/uploads/2021/02/fig1.PNG
https://britastro.org/wp-content/uploads/2021/02/fig1.PNG
| The British Astronomical Association supports amateur astronomers around the UK and the rest of the world. Find out more about the BAA or join us. |