A free, Excel-based application for UBVIc photometric studies of galactic open clusters
2024 June 9
Due to their discrete brightness and uncrowded appearance, open clusters are accessible to many amateur instruments. Moreover, their photometric study allows evolutionary models developed for Population I stars to be tested. This paper presents a free interactive Excel application for this type of study. Among other things, it is an attempt to use Excel beyond its standard capabilities, applying it to a specific astronomical field.
Introduction
The photometric study of galactic clusters is often considered unsuitable for amateurs. This may be due to the large number of calculations required and the difficulties in analysing and interpreting photometric data. Therefore, an attempt was made to develop an interactive automatic procedure capable of analysing photometric data, with the aim of showing the scenario resulting from a complete photometric study. The resulting Excel application is presented here, with the basic theory, how the code works, and some important key points.
The software
This application can be used either for advanced amateur research or simply for educational purposes such as classroom demonstrations or the training of astronomy students. To transform Excel into a dedicated code suitable for studying open clusters, a number of different algorithms must be implemented. The code requires well-standardised UBVIc data, meaning the reduction and standardisation of instrumental data are fundamental prior steps to ensure success of the Excel analysis. Using some spreadsheets, together with the standard techniques associated with photometric diagrams, the observed data can be analysed to obtain various parameters such as: intrinsic colours, effective temperatures (Teff), distances, absolute magnitudes, bolometric magnitudes (Mbol), ages, metallicities, luminosity functions, present day mass functions and many other data.1,2
The code comes with some default clusters for UBV and BVIc photometry, whose photometric values are taken from the NASA Astrophysics Data System (ADS) technical literature. Default clusters are essential as they are supported by various suggestions provided by the code and are useful to become familiar with the behaviour of the application. They have also been chosen to represent and cover all possible situations. Of course, the user can add and store their own data up to a maximum of 500 clusters for each type of photometry.
The observational data
Although open clusters can be studied using a variety of photometric systems, this code focuses on the use of the UBVIc system, which is fairly common among amateurs. The observational data of cluster members are essentially apparent magnitudes and colours, and several steps are required to convert these into luminosities and effective temperatures. Apparent magnitudes and colours are corrected for extinction and reddening effects, and absolute magnitudes obtained if the distance is known. To compare observations with theoretical stellar models, the fraction of flux not detected by our observing window is accounted for using the bolometric correction.3 Conversion of colours into effective temperatures, and absolute magnitudes into luminosities, now becomes possible. The final step is to compare the data with theoretical tracks and isochrones. For significant results, mean errors and uncertainties must be minimised. The light signal can suffer various losses due to the combined effect of the instrumental system, atmospheric absorption and interstellar absorption. The first two are handled by reduction and standardisation. The code evaluates reddening due to interstellar absorption as detailed below.
The average cluster colour excess ⟨E(B − V)⟩
The rarefied gas and dust in the interstellar medium (ISM) act as filters, such that stars are dimmed (extinction) and appear redder (reddening) than their true colours. Therefore, apparent magnitudes and colours require adjustment to provide a closer representation of physical reality. Extinction can be defined as the difference between the observed magnitude and the magnitude that would be measured if the ISM were completely transparent. Reddening, or colour excess, can be defined as the difference between the observed and the intrinsic colour of a star. The code quantifies extinction and reddening as follows.
In the UBV system, magnitudes observed using ultraviolet (U), blue (B), and visual (V) filters are used to calculate the (U − B) and (B − V) colour indices. The amount of ultraviolet radiation emitted by a star is measured by the (U − B) index, and its temperature by the (B − V). Using these indices, two fundamental diagrams can be constructed: the colour versus colour or two-colour diagram (TCD), and the colour versus magnitude diagram. The TCD is particularly useful for obtaining both the average cluster reddening <E(B − V)> and each individual reddening for cluster members belonging to the early spectral classes O, B.
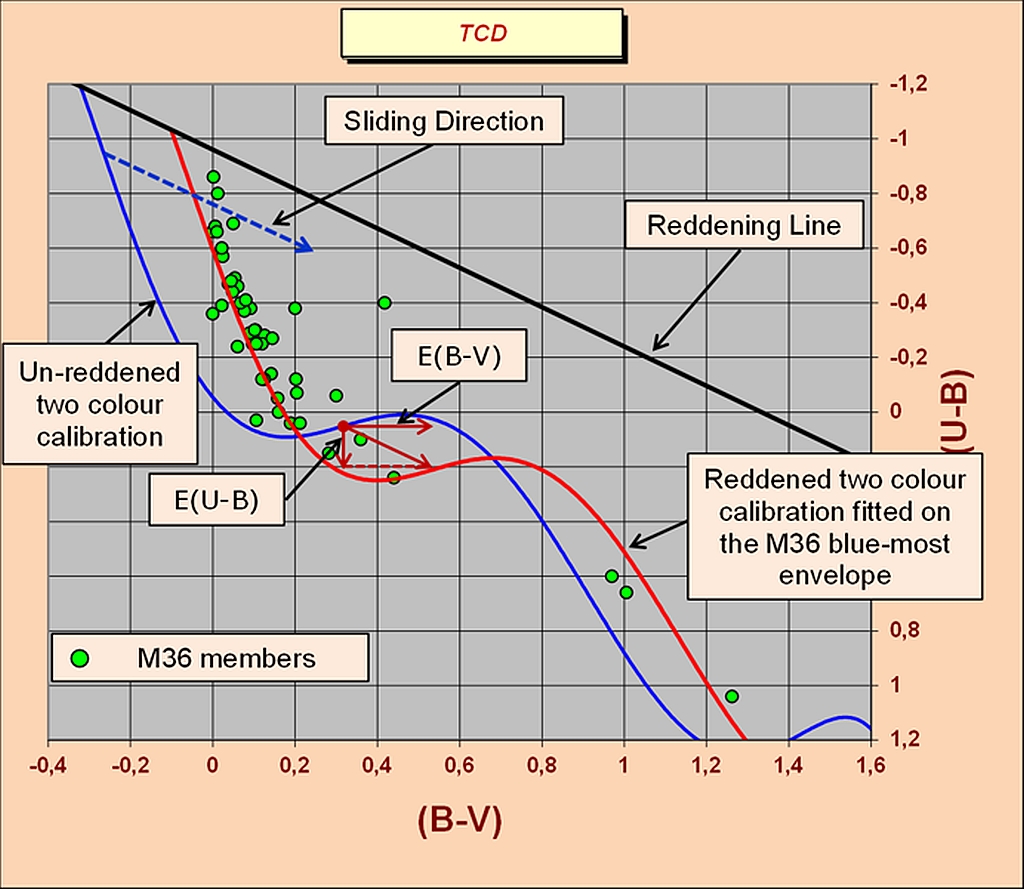
This is illustrated in Figure 1, using the example of the cluster M36. The Schmidt-Kaler de-reddened two-colour calibration,4 i.e. the locus of the intrinsic colours (blue curve), is shown shifted along the slope of the reddening line (RL; black line), until the blue-most envelope of the cluster is reached (red curve). The amount of this shift represents the average cluster colour excess <E(B − V)>. This is a very delicate process, and the code requires the judgement of the user to identify the blue-most envelope of the cluster on the TCD.
The code can help the user identify the blue-most envelope, by performing a scan of the intrinsic calibration along the slope imposed by the RL. Figure 2 shows the result of this scan for the southern cluster, IC 2581. The histogram clearly shows that the count density changes between 0.38 and 0.43 E(B − V). The left slope of the histogram represents the boundary of the foreground reddening for IC 2581. Therefore, a sliding fit must be performed whereby the de-reddened intrinsic calibration is moved on the TCD while also finding the best fit with the cluster array around this E(B − V) range.
Members can view the full illustrated article in PDF format by returning to the previous page. Not a member? Why not join today?
| The British Astronomical Association supports amateur astronomers around the UK and the rest of the world. Find out more about the BAA or join us. |