HR Lyrae: the restless slumbers of an old nova
2022 April 6
A report of the Variable Star Section. Director: J. Shears.
We present the light curve of the old nova HR Lyr between 2013 and 2019. This reveals that the system mostly varies over the magnitude range 15.2 to 16.5. The characteristic features are near-sinusoidal variations with amplitude up to 1mag, although without coherent periodicity. There are some years when these were prominent: for example, 2015, 2018 and 2019. By contrast, they were almost absent during other years (2013 and 2017). Another prominent feature in the light curve is a 70-day-long fading event during 2016, when the magnitude dropped from ~16.0 to ~17.3. We also present results of a campaign organised by the Variable Star Section of the BAA during 2019 to observe HR Lyr. CCD photometry revealed small hump-like features in the light curve. These were variable in size; they were generally around 0.1 to 0.2mag in peak-to-peak amplitude, but the larger ones had an amplitude of ~0.3mag. They occurred on timescales of 20 to 40 minutes, although without a stable period, and were similar to the flickering seen in many cataclysmic variables. The long-term fading trend of HR Lyr over the interval 1991 to 2019 was 0.006 ± 0.004mag/year, which is consistent with the values reported by others.
Introduction to HR Lyr: a century of observations
The year 2019 marked the centenary of the discovery of Nova Lyrae 1919. HR Lyr, as it is now known, was a magnitude 6.5 nova discovered on 1919 Dec 6 by Johanna C. Mackie at the Harvard College Observatory.1 The decline from eruption was fairly well covered, showing a rapid (t3 ~ 80 days) and smooth decay. A review of the photometric history of HR Lyr was presented in the BAA Journal in 2007,2 finding that the system has been relatively stable at V ~ 16 ever since occasional post-nova monitoring (initially comprising visual observations) began in 1925. More recently, the 22-year light curve between 1991 and 2012 was presented by Honeycutt et al. (2014),3 based on photometry from the Indiana University remote monitoring programme supplemented with photometry from the Bunbury Observatory and the American Association of Variable Star Observers (AAVSO). This showed that the system varied over the range V = 15.3–16.3, with occasional excursions to V ~ 17. One of these fades, in 2010, was discussed in the Journal.4 The light-curve variations often took the form of nearly linear rises and falls on a timescale of about 100 days. Occasional ∼0.6mag brightening episodes were also seen, with properties similar to those found in some nova-like cataclysmic variables.
Leibowitz et al. (1995),5 working at the Wise Observatory in the 1990s, reported quasi-periodic variations in HR Lyr’s light curve with a periodicity of around 0.1 days, which they speculated may be associated with the orbital period. However, no definitive period for the orbit has been published.
Limited spectroscopic studies have been performed on HR Lyr. Williams (1983) presented a spectrum taken in 1981 which is almost featureless.6 The absence of Balmer or He emission lines in the optical waveband is somewhat puzzling, but the quality of the spectrum presented is relatively poor. It must be noted that several other novae that had no recognisable emission lines in Williams’ paper were subsequently found to show Balmer lines in better-quality spectroscopy. Hydrogen emission lines were detected in the near-infrared in 2006 by Harrison et al. (2013).7
Selvelli & Gilmozzi (2019) have studied 18 classical novae that have Gaia parallaxes,8 and HR Lyr does not stand out in any metric.
Apart from photometric monitoring, HR Lyr has not received much attention. Therefore, a campaign was launched by the BAA Variable Star Section (VSS) in early 2019,9 to cover the whole observing season, with the aim of deepening our understanding of the object’s photometric behaviour on a range of timescales.
This report summarises the results of the campaign and presents the longer-time light curve of HR Lyr from 2013 to 2019.
Observations
To produce a long-term light curve of HR Lyr, we used CCD photometry from the BAA VSS database and the AAVSO International Database. The photometry comprised either unfiltered CCD measurements with V-band comparison stars or V-band CCD measurements. Measurements in other colour bands were excluded from this study.
The observers whose photometry was used are listed in Table 1. V-band and g-band photometry from the All Sky Automated Survey for Supernovae (ASAS-SN) was also used, covering the interval between 2014 Nov 1 and 2019 Nov 25. This is an automated sky survey to search for new supernovae and other astronomical transients,10,11,12 which is able to detect and perform photometry on objects down to 18th magnitude. V-band data from the AAVSO Photometric All-Sky Survey (APASS) were also used.13
Results & discussion
Long-term light curve
Figure 1 shows the entirety of the 2013–’19 light curve of HR Lyr. Over this seven-year interval, the system is seen mostly to vary over the magnitude range 15.2 to 16.5, with one excursion to magnitude 17.3. Figure 2 shows the light curve for each year under consideration, on an expanded scale.
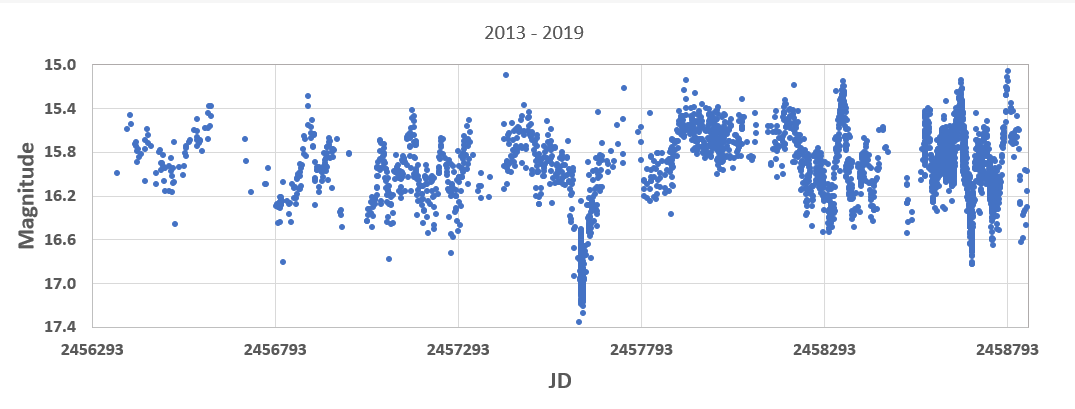
The main features in Figure 2 are near-sinusoidal variations of up to 1mag in amplitude. There are some years when these were prominent: for example, 2015, 2018 and 2019. By contrast, they were almost absent during other years (2013 and 2017). This behaviour is similar to that seen in the 1991–2012 light curve presented by Honeycutt et al.3
Visual inspection of the light curves shows that the variations occur in an irregular manner, although during 2015, four consecutive 0.6mag episodes did appear to be at least quasi-periodic, being separated by ~84, 82 and 74 days.
The system was particularly active in the second half of 2018 and throughout 2019, when several successive brightening episodes of up to 1mag were observed. In fact, it appeared to be continuously brightening and fading. Each episode lasted about 50 days, with the maxima separated by 40 to 70 days. The profiles of three of these episodes, with maxima around JD 2458344, 2458667 and 2458796, superficially look rather similar and each had an amplitude of up to ~1mag. These were interspersed with smaller-amplitude ~0.5mag variations, with a similar duration of ~50 days. It is also worth noting that during the peak of the final brightening episode in 2019, HR Lyr was magnitude ~15.0: brighter than it had been since 2006.
(Login or click above to view the full illustrated article in PDF format)
| The British Astronomical Association supports amateur astronomers around the UK and the rest of the world. Find out more about the BAA or join us. |