Jupiter in 1950 & the aftermath of a South Equatorial Belt Revival
2022 June 6
The 37th report of the Jupiter Section. Director: J. H. Rogers.
At the previous opposition of 1949 there had been a Revival of the South Equatorial Belt (SEB). In 1950, the Great Red Spot was still invisible within its Hollow. The SEB no longer showed any features of the Revival, but its S. component (SEB(S)) showed a characteristic post-Revival orange tint. The few visible SEB(S) features moved at velocities close to System II, with two barges on its N. edge exhibiting opposing drifts and amalgamating in October. The long-enduring South Temperate white ovals BC and DE had become abnormally close. A number of small white ovals appeared at the N. edge of the South South Temperate Belt. Other developments included the appearance of a large white spot in the southern Equatorial Zone, preceding a section of dark SEB(N); its rotation period lengthened following conjunction with the Red Spot Hollow. There was significant white spot activity in the North Equatorial Belt Zone, as well as a new outbreak of dark spots at the N. edge of the North Temperate Belt, while the North North Temperate Belt had largely faded away to leave some near-stationary dark sections. These changes are described here in detail for the first time. The 1950 opposition was the first in which good amateur photographs became available for analysis. Also, the first Jupiter photographs were taken with the new 200-inch Palomar reflector, while colour composite images could be prepared from sets of filter photographs taken at Lowell Observatory. However, we are reminded that nearly all observational results from that epoch were still derived by visual observation. To complete the historical record, a short appendix presents unpublished tables of rotation periods for the following apparition, 1951–’52.
Introduction
The author recently presented a detailed study of the 1949 Revival of Jupiter’s South Equatorial Belt.1 As the sequence of events had not ceased by late 1949, the author looked for patterns of activity during the following year. As with 1949, no BAA account of the 1950 opposition has previously been published,2 though a short typescript was prepared by W. E. Fox,3 and a summary of the mean rotation periods he deduced appeared in a Section Memoir.4
Jupiter came to opposition on 1950 Aug 26 in Aquarius, at declination –12°. While the planet was still not well placed for British
observers, it was 10 degrees higher in the sky than in 1949, and they were able to accomplish much more work. The greatest number of transit observations (550) was again made by E. E. Hare (Owensboro, Kentucky, USA), who had succeeded E. J. Reese as Jupiter Recorder for the Association of Lunar & Planetary Observers (ALPO). Hare provided graphs of ALPO transit data, as well as photographs that were remarkably good for the time (Figure 2). Very good series of transit observations were also made by A. F. A. L. Jones (Timaru, New Zealand), W. E. Fox (Newark, UK), R. A. McIntosh (Auckland, New Zealand), and S. Murayama (Tokyo, Japan). Fox, Hare, Murayama, Reese (Uniontown, Pennsylvania, USA) and G. Ruggieri (Venezia, Italy) made some good drawings, while 61 sketches were contributed by McIntosh. The other BAA observers (some of whom only made observations of the satellites) were F. J. Acfield, F. M. Bateson (Rarotonga, Cook Islands), W. W. Buckeridge, E. H. Collinson, G. H. Corbett, J. Friends, W. A. Granger, A. P. Lenham, L. Llewellyn Lloyd, P. A. Moore, H. P. Wilkins and T. W. Williams.
For this paper all the original transit observations have been checked and replotted, and the author had access to considerably more material than was available to Fox. There are minor differences between the mean periods given here and the Memoir, but moreover it was possible to derive drift rates for considerably more spots and more currents. The author has also made use of the observations published by J. E. Focas (a former Section contributor who used the 16-inch refractor at the National Observatory of Athens, Greece).5 A copy of the original work of the German observer W. Löbering was provided by H-J. Mettig. Reese did not originally submit drawings for 1950, but as for 1949 a complete scanned copy of his logbook was obtained from New Mexico State University Library, as was one of that of W. H. Haas.6 A few observations by other UK observers, namely G. E. D. Alcock and B. Burrell, were found in the BAA archives.
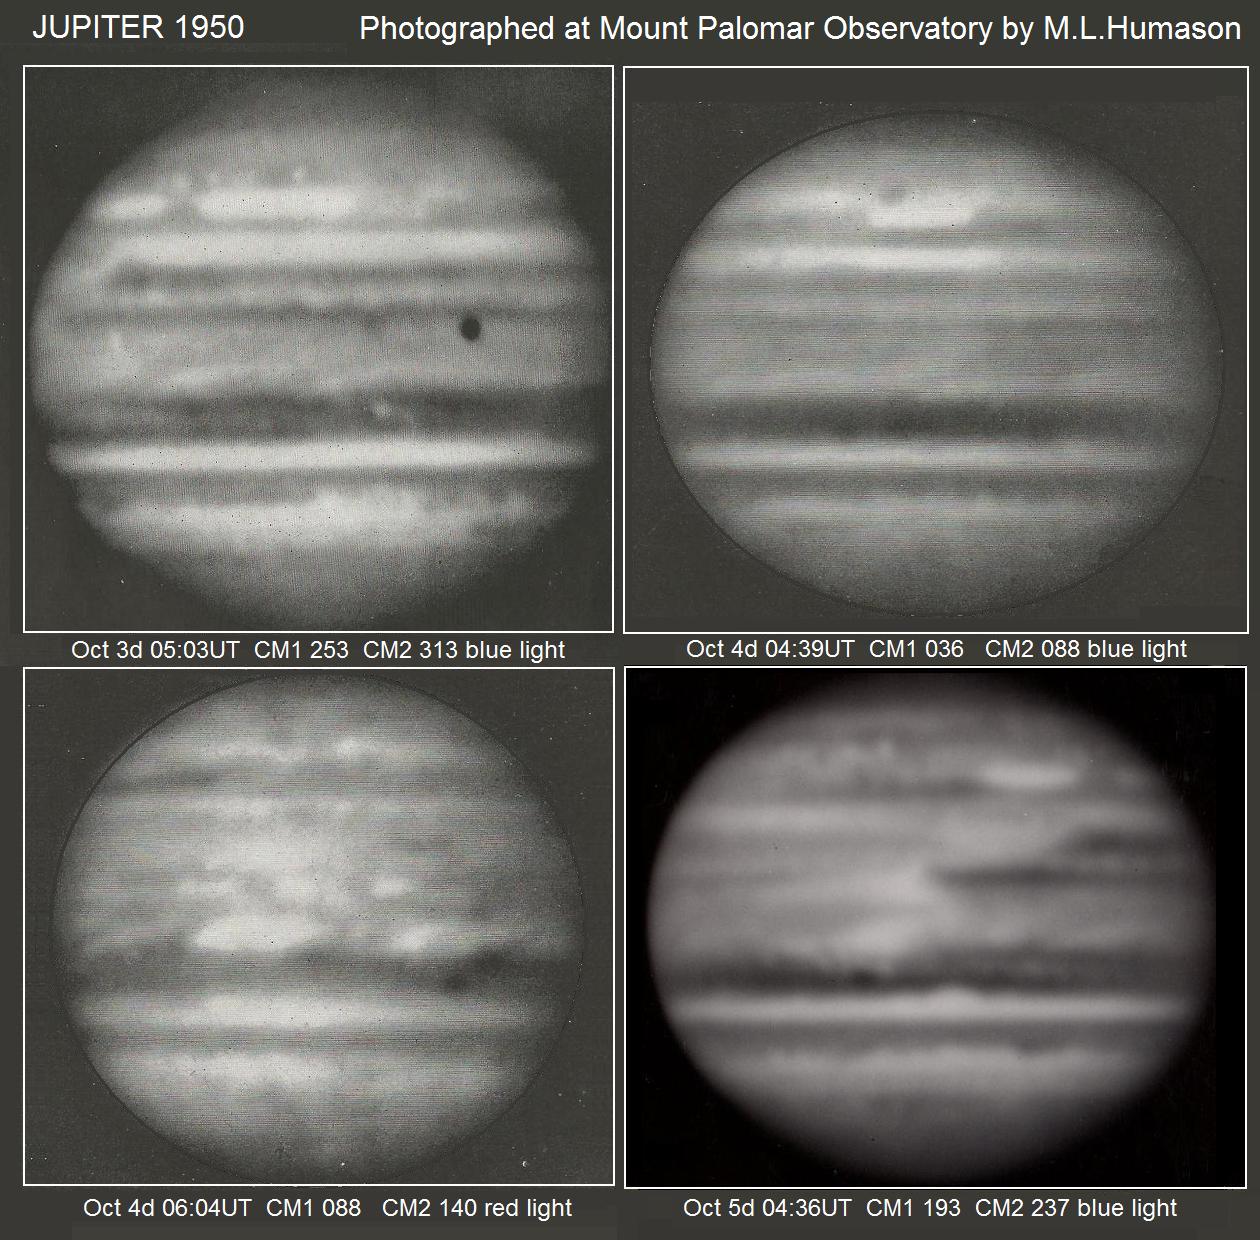
This was the first opposition at which photographs were taken (by M. L. Humason) with the then-new 200-inch Mount Palomar reflector (Figure 1A), while Dr E. C. Slipher continued his programme of photography at Lowell Observatory (Figure 1B). As for 1949, scans of Slipher’s filter photographs were kindly provided by archivist Lauren Amundson, and the best images were selected and composited by the author. Following this, a number of colour composites (Figure 1B) were skilfully prepared by Emmanuel Kardasis. Positional and latitude measurements were made upon the Palomar and Lowell Observatory photographs. Hare measured longitudes from his own photographs (Figure 1C).7 Observations extended from 1950 Mar 13 till Dec 27, with solar conjunctions on 1950 Feb 3 and 1951 Mar 11.
A few papers about the 1950 opposition were published in Germany, but none of them were comprehensive.8 Short summaries were published by the ALPO.9 Reese (1957) derived an incomplete set of rotation periods from ALPO data.10 A short description was published by former Section member C. F. M. du Martheray (Geneva, Switzerland).11 BAA rotation periods for the following apparition of 1951–’52 were never published in detail, and an appendix to this paper rectifies this deficit.
The present paper is a sequel to our report for 1949:1 until the 1950s, the reports of the Section had been numbered, and the present one is the 37th.12
The observations
Observations of colour and relative intensity are sometimes mentioned in the text, but a full summary appears in Table 1. Belt latitudes are given in Table 2. Tables of drift rates and rotation periods are placed at the end. Longitudes of features in Systems I and II are denoted by λ1 and λ2, respectively. Δλ1 and Δλ2 denote drift rates in degrees per 30 days (hereafter °/mo). ω1 and ω2 denote the longitude of the central meridian according to Systems I and II.
North Polar Region (NPR)
The NNNTB was seen to limit the S. edge of the N. polar shading. Some small dark spots were present, which were well shown by the Flagstaff and Palomar photographs (Figure 1A–B). Several were tracked for short periods and were either stationary in System II or showing small negative drifts, but the observations never continued long enough to derive rotation periods. There were some difficult, still higher-latitude belts visible to Focas and Hare (Figure 3). Indeed, Focas reported the NPR to be finely banded on occasion, and in December observed a festoon apparently connecting the NNNTB and NNTB across the NNTeZ.
North North Temperate Zone (NNTZ)
This light zone showed slight activity, as described under ‘NNTB’ below.
(Login or click above to view the full illustrated article in PDF format)
| The British Astronomical Association supports amateur astronomers around the UK and the rest of the world. Find out more about the BAA or join us. |