Latitude movements of solar prominences, 2010–’17
2019 October 2
Introduction
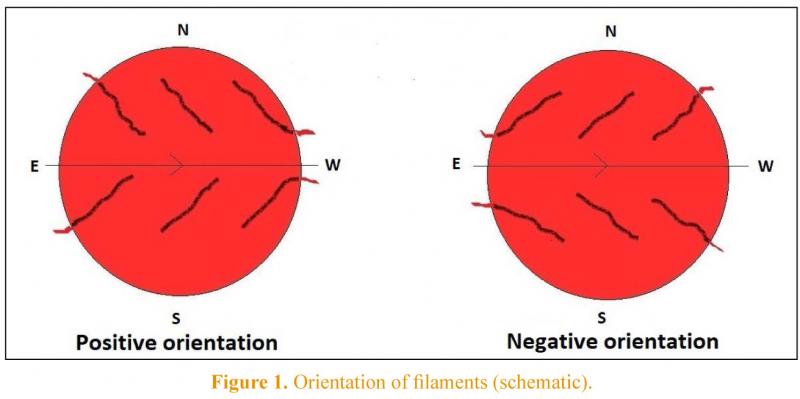 Most prominences at the Sun’s limb have longitudinal axes which extend onto the disk as dark filaments (Figure 1), although they often lack contrast and are not always easy to see in small H-alpha telescopes. These, like all filaments, form at the boundaries between magnetic fields of opposite polarity. Lower latitude or ‘equatorial’ prominences occur within and between sunspot active regions, and are closely associated with sunspots in latitude, position and activity. ‘Polar’ prominences are much less closely related to sunspots since they are located outside the customary sunspot zone, i.e. above latitude 40°.
Two types of apparent prominence movement can be discerned: a relatively slow drift of mean positions towards the poles or the equator, and a more rapid day-to-day shift in the latitude of individual prominences. Although filaments are dynamic structures, all but the smallest are relatively stable in shape and position over 24 hours. Day-to-day prominence shifts can therefore be used to map the orientation of filaments, and their corresponding magnetic field boundaries, with respect to the solar poles and equator.
Observations
A Coronado H-alpha PST (Personal Solar Telescope) was used, fitted with a rotating reticle eyepiece, at a magnification of ×32. The Sun’s parallactic angle was determined by the ‘drift’ method, and the position angles of prominences around the Sun’s disk measured and recorded. The base of a prominence (or central point) defined its position: measurements were reproducible to ±1°. As a check on accuracy, sunspot active region coordinates were also measured and compared with published values. Positions were plotted onto a 150mm outline of the Sun’s disk, converted to true heliographic latitudes using published values of P and B0 and an appropriate Stoneyhurst template. Thereafter heliographic latitudes were used for statistical analysis.
Observations were carried out during the rise of sunspot activity leading to the 2014 solar maximum, and the subsequent decline towards solar minimum. I am very grateful to the BAA Solar Section for sunspot activity data, which were obtained from the Section’s monthly reports in the Journal. Mean latitudes of sunspot groups were derived from the NOAA archive. (continued)
(Login or click above to view the full illustrated article in PDF format)
| The British Astronomical Association supports amateur astronomers around the UK and the rest of the world. Find out more about the BAA or join us. |