Lunar domes near the crater Cleomedes
2024 April 5
The Nectarian-aged Crisium basin is characterised by prolonged lunar volcanism ranging from the Imbrian age to the Eratosthenian period. In this study, two shallow lunar domes designated Cleomedes1–2 are described and identified using terrestrial telescopic imagery, Lunar Reconnaissance Orbiter (LRO) Wide-Angle Camera (WAC) images, the Laser Altimeter Digital Elevation Model (LOLA DEM), and the LRO WAC-based GLD100 Digital Terrain Model, along with data from the Chandrayaan-1 Moon Mineralogy Mapper and Kaguya Multiband Imager. The dome Cleomedes 1 is located at 21.8°N, 54.8°E, with a diameter of 4.0 km and height of 40 ± 5 m, yielding an average flank slope of 1.14 ± 0.1°. The dome Cleomedes 2 is located at 21.9°N, 55.2°E, with a base diameter of 3.5 km and height of 35 ± 5 m, yielding an average flank slope of 1.1 ± 0.1°. These domes are not reported in the USGS I-707 map by Casella & Binder. Based on the morphometric properties, the physical conditions under which the domes were formed (lava viscosity, effusion rate, magma rise speed, and the geometries of the feeder dikes) are inferred.
Introduction
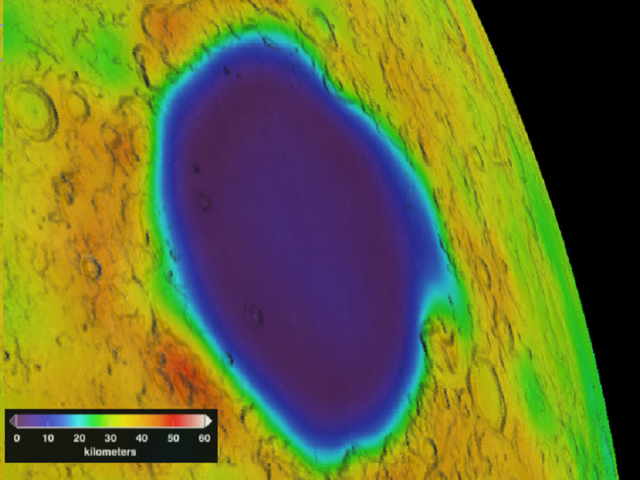
The Nectarian-aged Crisium basin exhibits an extremely thin crust (Figure 1). This large multi-ring impact basin is characterised by prolonged lunar volcanism ranging from the Imbrian age to the Eratosthenian period, forming the high-Ti mare unit, low-Ti mare basalts, and very low-Ti mare unit.1 The major phase of low-Ti basaltic volcanism occurred ~3.5 billion years ago, forming the Im2 and Im3 units in the western area, as described by Lu et al. (2021).1 The Crisium basin concentric structure consists of a series of raised rings and intervening troughs. Three rugged rings are delineated in the circum-mare terra, and another lies within the mare. Rings are approximately 210, 250, 340, and 485 km from the basin centre. The raised rings are composed of pre-basin rock and overlying basin ejecta.13
The crustal thickness is inferred from the Bouguer gravity map. If the density of the crust is assumed to be uniform, then the gravity anomalies visible in this map can be explained by variations in the thickness of the crust.2 Highs in gravity indicate places where the mantle is closer to the surface, and hence where the crust is thinner (Figure 1).
In this study, the author examines two volcanic constructs identified using a telescopic terrestrial image (Figure 2) and uses the morphometric characteristics of the domes as a basis for estimation of viscosities, eruption rates and eruption durations, while also making assumptions on the feeder dikes geometry (e.g., length and width).
Ground-based telescopic image
The image of the examined region was taken on 2022 Oct 13 at 00:20 UT, by Viladrich using a Ritchey–Chrétien 500mm telescope. For image acquisition, an ASI 1600 camera was employed with a red filter.
Two dome-like features located to the west of Cleomedes F are detectable in the enlarged images shown in Figures 3 & 4.
Methods & materials
Lunar image data from the Lunar Reconnaissance Orbiter (LRO) Wide-Angle Camera (WAC; 100 m/px) and Narrow-Angle Camera (NAC; ~32 m/px) were used to map the parameters of the examined features, termed Cleomedes 1 and 2 (Cleo 1 and 2). The Lunar Orbiter Laser Altimeter (LOLA) data were then used (using 64 ppd maps) to create digital elevation models (DEMs) to determine the diameter and height of the domes.
The TiO2, FeO, plagioclase (Plag), olivine, clinopyroxene (CPX) and orthopyroxene (OPX) content in the abundance maps was derived from topographically correct mineral reflectance maps acquired by the JAXA SELENE/Kaguya mission. Table 1 displays the average derived mineralogical composition.
The Chandrayaan-1 Moon Mineralogy Mapper (M3) imaging reflectance spectrometer can detect 85 channels (460–3000 nm) with a spatial resolution of 140 m and 280 m/pixel. M3 data were calibrated, photometrically corrected and converted to apparent reflectance. The spectral continuum connects the reflectance values at 750 nm and 1500 nm; the reflectance spectrum is divided by this to obtain the continuum-removed spectrum.
The domes’ morphometric characteristics have also been examined by making use of a combined photoclinometry and shape-from-shading approach.3–4 This method makes use of the fact that surface parts inclined towards the light source appear brighter than those inclined away from it.4
LRO WAC imagery
In the LRO WAC imagery, the examined domes are not as prominent as in the telescopic terrestrial image taken under a lower angle of solar illumination and with a telescope of large diameter.
Based on the ACT-REACT QuickMap (target.lroc.asu.edu/da/qmap.html) and the tool Terrain Hillshade, the examined domes are detectable as shown in Figure 5.
Figure 6 displays the elevation of the examined domes on the digital terrain model (DTM). Note that the two domes – Cleo 1 and Cleo 2 – display low height and small diameter.
The examined domes are perpendicular to local wrinkle ridges in the northern Mare Crisium basin (Figure 6). This perpendicular alignment may be due to dome-forming lavas guided by internal stress fields, induced by major basin-forming impact events and also caused by crustal fractures and faulting. This alignment may also perpetuate the hypothesis that the stress fields caused by impact events can facilitate the ascent of dike material through the subsurface from the lunar mantle to the crust.5–6 From Wieczorek (2001),7 fractures are closed at depths of ~20 km, so that the stress field would favour the formation and ascension of dikes.
The derived GRAIL crustal thickness map (Figure 1) shows that Mare Crisium has a relatively thin crust (thickness of 15–20 km or less).
Results & discussion
Cleomedes 1
The dome Cleo 1 is located at 21.8°N, 54.8°E and has a diameter of 4.0 km. The height amounts to 40 ± 5 m, yielding an average flank slope of 1.14 ± 0.1°. The ACT-REACT QuickMap tool was used to access the LOLA DEM dataset, obtaining the cross-sectional profile (Figure 7). The dome edifice volume is determined to be 0.3 km³, assuming a parabolic shape.
A well-known image-based method for 3-D surface reconstruction of terrestrial imagery is shape-from-shading (SfS). It makes use of the fact that surface parts inclined towards the light source appear brighter than those inclined away from it. The SfS approach aims to derive the orientation of the surface at each image location by using a model of the reflectance properties of the surface and knowledge about the illumination conditions, finally leading to an elevation value for each image pixel.3–4
The height h of a dome is obtained by measuring the altitude difference in the reconstructed 3-D profile between the dome summit and the surrounding surface, considering the curvature of the lunar surface. The average flank slope was determined according to slope = arctan 2h/D, with D the diameter in kilometres. The uncertainty results in a relative standard error in h of ±10 per cent, which is independent of the height value itself. D can be measured at an accuracy of ±5 per cent.
The 3-D reconstruction of Cleo 1 is reported in Figure 8.
Members can view the full illustrated article in PDF format by returning to the previous page. Not a member? Why not join today?
| The British Astronomical Association supports amateur astronomers around the UK and the rest of the world. Find out more about the BAA or join us. |