Observations of another Venusian atmospheric discontinuity, 2022 May to September
2023 February 7
A report of the Mercury & Venus Section. Director: P. G. Abel
We discuss observations of Venus made during 2022 May–September which demonstrate the reappearance, after an interval of two years, of the remarkable type of north–south atmospheric discontinuity first observed in 2015. This feature, observable only in the infrared, was around 4,600km long and not wider than 200km. Its mean rotation period was measured from current Section observations to be 4.97 ± 0.03 days.
Introduction
In 2015–’16, the Akatsuki spacecraft observed a 10,000km-long meridianally-orientated cloud discontinuity in the far-infrared waveband (10μm/10,000nm).1 This remarkable but short-lived feature, referred to by investigators as an atmospheric gravity wave, was stationary with respect to the surface. Section observers could follow morphologically similar features in series of observations made during 2016 October–December, 2019 December and 2020 March–April, but these discontinuities were imaged in the near-infrared region at 685–1000nm, and showed a rotation period of around five days, typical for that waveband.2
Images taken during the 2022 western (morning) elongation of Venus show that the same type of meridianal cloud discontinuity as the ones observed in 2016–2020 has again been recorded in infrared images taken by Section members.3 The first detection was on 2022 May 5, when the disc diameter was 16 arcseconds and the phase 0.69. Given the fairly low frequency of observation at morning elongations, this earliest sighting may not represent its actual origin. Particularly useful images have been taken by A. Cidadão (Portugal), C. Foster (South Africa) and L. Morrone (Italy), while some other good images by observers who do not contribute to the Mercury & Venus Section are available online, primarily at the ALPO-Japan website.4 Cidadão obtained by far the longest series of images, most of which were of high resolution, and made several animations over a series of hours that clearly showed the rotation of the discontinuity and other cloud features. His work shows great determination, as well as skilful imaging and processing techniques. Considerable processing was needed to clearly reveal the discontinuity, as raw infrared images are of fairly low contrast.
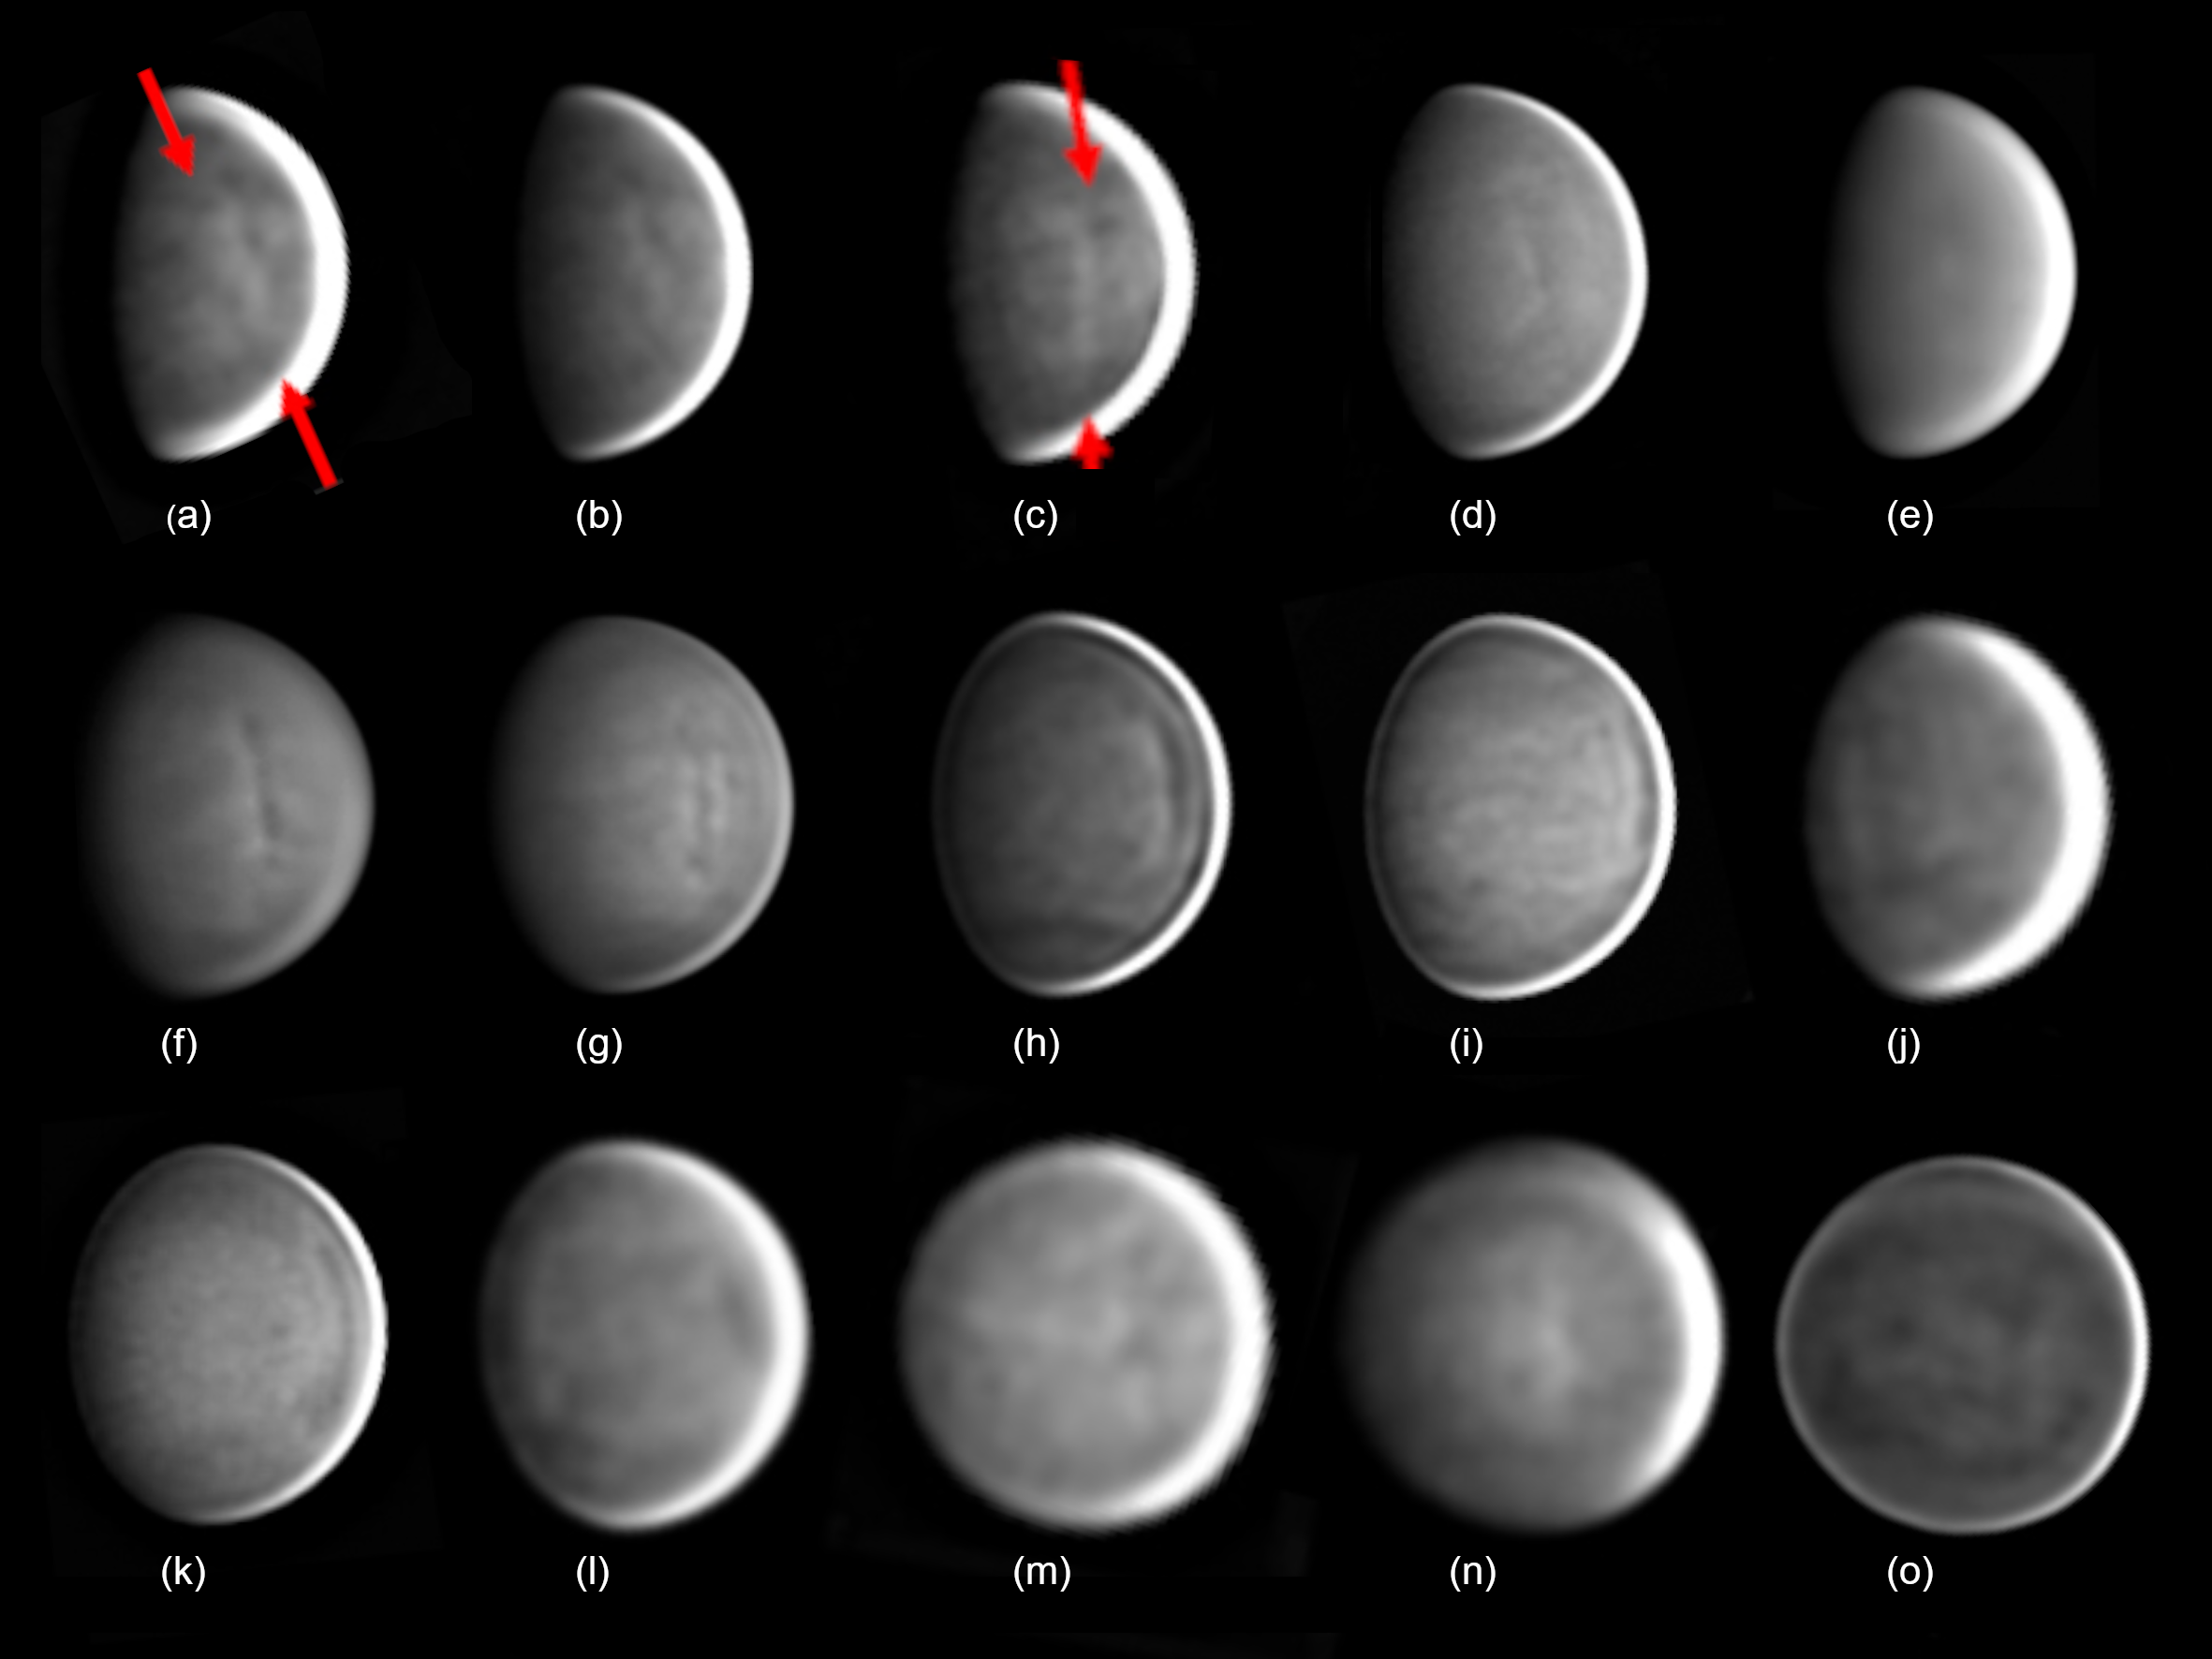
(a) May 5, 06:22. (b) May 10, 07:38. (c) May 15, 08:25. (d) May 25, 07:12. (e) May 30, 05:24. (f) Jun 4, 05:19. (g) Jun 14, 05:27. (h) Jun 19, 06:16. (i) Jun 24, 07:48. (j) Jun 28, 11:05. (k) Jul 9, 06:45. (l) Jul 13, 11:31. (m) Aug 22, 09:48. (n) Sep 2, 08:03. (o) Sep 16, 09:14.
Measurements of the vertical extent of the discontinuity during the month covering its first appearance, from May 5 – Jun 4, yield a mean length of some 4,600km. In our earlier study,2 we obtained a range in length of 2,900–7,000km from amateur images, and the mean of around 5,200km is not appreciably different from the 2022 figure, though both are considerably smaller than the value of some 10,000km measured for the wave imaged by Akatsuki.1 As in its previous apparitions, the discontinuity was approximately symmetrical with respect to the planet’s equator. But some of the earlier observations showed it slightly inclined to the rotational axis, leading to difficulty in the measurement of its midpoint. Its apparent mean width – doubtless affected by strong image processing – was about 250km, with a minimum of 180km. Our earlier study, conducted upon generally less sharp images, gave a minimum of around 340km.2
At first, the discontinuity was seen to be located closer to the limb than to the terminator at the observing times typically available to our European and South African observers, and it was visible only at intervals of five days. Later, the planet’s phase became large enough to allow the feature to be imaged close to the terminator upon images taken one day earlier in the five-day rotational cycle. Measurements from the images were hampered by the feature not being completely sharp. We took its position from the midpoint between its bright and dark parts, or the middle of the bright part if only that was visible. It could not be measured to a precision better than ~2° in longitude, leading to an uncertainty in each determination of its period of not less than ±0.01 days.
A mean synodic rotation period of 4.97 ± 0.03 days has been deduced from selected image pairs: see Table 1. The rotation periods for the 2019 December and 2020 March–April atmospheric waves followed by the Section were found to be 5.04 ± 0.04 days (approximately), and 5.01 ± 0.01 days (more precisely), respectively.2 These are perfectly normal periods for markings recorded in this waveband and there is no significant trend in the period within these three time intervals. The figures may be compared with an average period of 4.72 days derived by the Section for other (normal) features from deep red and near-infrared images in 2010:5 these features must have been at nearly the same level in the atmosphere.6
Morphologically, the discontinuity appeared as a dark vertical feature, sometimes exhibiting small condensations, and with a brighter strip on one side. Sometimes only one or two bright strips were seen. Some examples of its appearance, orientated with south uppermost, are given in Figure 1. The feature’s N–S extent apparently shrank in the later observations.
Cidadão alone continued to obtain recognisable images of the feature up to Sep 16. We have examined all the images up to and including Sep 30 without finding any further definite sightings. Thus, the discontinuity was followed for over four months, though it may have existed longer. By Sep 16, the planet’s phase had increased to nearly 0.99 but its disc diameter was now barely 10 arcseconds, and consequently the resolution for the later images must have suffered somewhat.
(Login or click above to view the full illustrated article in PDF format)
| The British Astronomical Association supports amateur astronomers around the UK and the rest of the world. Find out more about the BAA or join us. |