Observations of the first confirmed superoutburst of the dwarf nova DDE 39
2022 December 8
We present the light curve of the dwarf nova DDE 39 (= 1RXS J040253.8+435553) between 2011 October and 2021 January, which reveals two bright outbursts: one in 2018 January and the one in 2020 December which is discussed in this paper. There is also evidence of two fainter outbursts: one in 2012 January and another in 2020 October, reaching magnitude 16.3 and 16.0 respectively. We report digital photometry of the 2020 December outburst. At its brightest, the system reached magnitude 15.1 – about four magnitudes above quiescence – and the event lasted at least 11 days. Superhumps with peak-to-peak amplitude of up to 0.4 magnitudes were present during the outburst, thereby establishing it to be a member of the SU UMa family. The mean superhump period, based on a linear analysis of superhump maxima, was Psh = 0.08176(235)d. Period analysis of the superhump signal yields Psh = 0.08199(24)d.
Introduction
Dwarf novae form a class of cataclysmic variable star in which a white-dwarf primary accretes material from a secondary star via Roche lobe overflow. The secondary is usually a late-type main-sequence star. In the absence of a significant white-dwarf magnetic field, material from the secondary is processed through an accretion disc before settling on the surface of the white dwarf. As material builds up in the disc, a thermal instability is triggered that drives the disc into a hotter, brighter state, causing an outburst in which the star brightens by several magnitudes.
Dwarf novae of the SU UMa family occasionally exhibit superoutbursts which last several times longer than normal events and may be up to a magnitude brighter. During a superoutburst, the light curve of an SU UMa star is characterised by superhumps. These are modulations in the light curve which are a few percent longer than the orbital period. They are thought to arise from the interaction of the secondary-star orbit with a slowly precessing, eccentric accretion disc. The eccentricity of the disc arises because a 3:1 resonance occurs between the secondary star orbit and the motion of matter in the outer accretion disc. For a more detailed review of SU UMa dwarf novae and superhumps, the reader is directed to references 1 & 2.
DDE 39 was identified as a dwarf nova by Denis Denisenko (Sternberg Astronomical Institute of Moscow State University) in 2015 July and listed in his catalogue of variable stars discovered, as number 39.3 He presented an animation of 1953 and 1993 Palomar Observatory Sky Survey (POSS) blue plates showing the variability and proper motion of the object,4 noting that it was consistent with GALEX J040252.7+435544 (it is also referred to as 1RXS J040253.8+435553).
DDE 39 is located in Perseus at RA 04h 02m 52.70s, Dec. +43° 55ʹ 44.8ʺ (J2000.0).
This paper reviews the long-term light curve of DDE 39 and presents photometry of an outburst observed during 2020 December and 2021 January.
Light curve of DDE 39 from 2011 to 2021
The light curve of DDE 39 between 2011 Oct 27 and 2021 Jan 16 is presented in Figure 1, which includes data from the BAA Variable Star Section (VSS) and American Association of Variable Star Observers (AAVSO) databases; Panoramic Survey Telescope and Rapid Response System (Pan-STARRS, located at Haleakalā Observatory, Hawaii, USA); the Zwicky Transient Facility (ZTF; a wide-field sky astronomical survey at the Palomar Observatory, USA) and the All-Sky Automated Survey for Supernovae (ASAS-SN) project. The ASAS-SN V-band data mean magnitude was 17.15 (± 0.03) in quiescence; ZTF mean data were 19.18g and 18.80r.
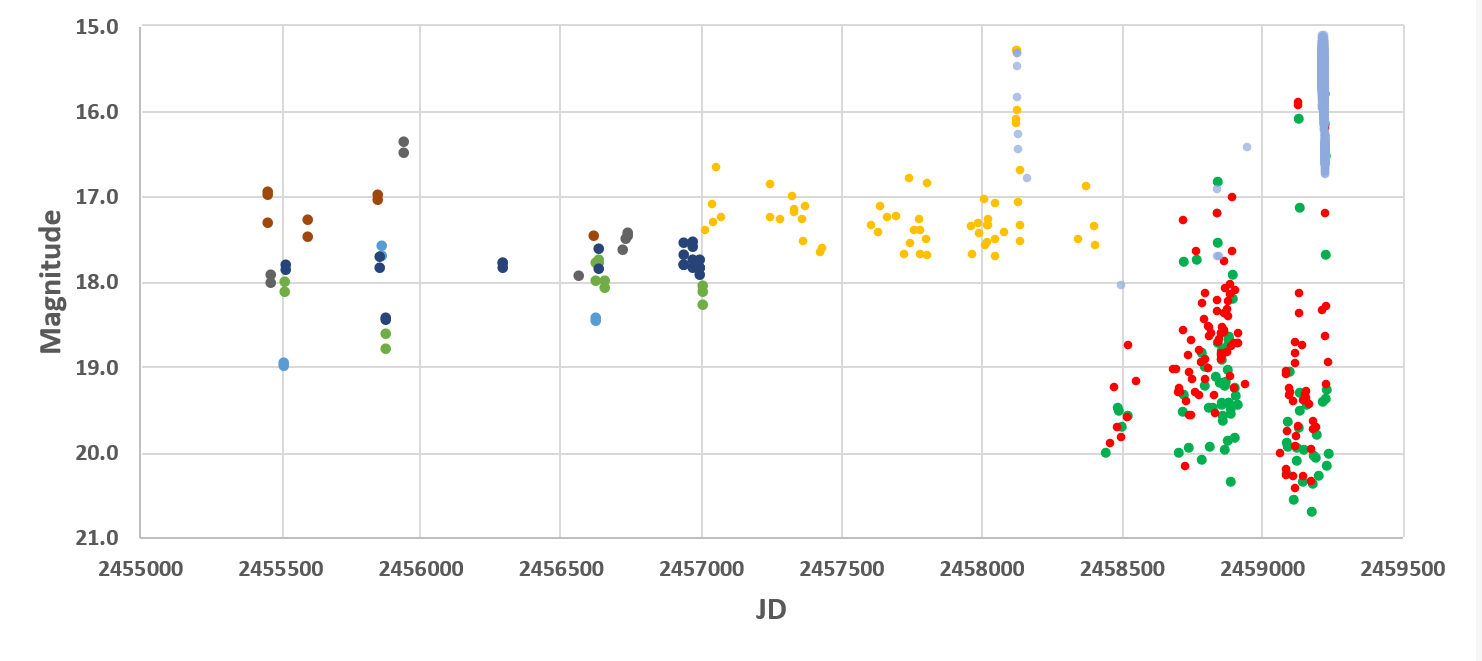
Two bright outbursts are evident: one reaching magnitude 15.3 in early 2018 January, and the one during 2020 December discussed in the present paper. There is also evidence of two fainter outbursts: one in 2012 January, reaching magnitude 16.3 in Pan-STARRS y-band data (IR), and another to magnitude 16.0 in ZTF data during 2020 October. We note that both these outbursts, although apparently not as bright, were not well defined due to sparse coverage, so their maxima might have been missed. It is possible that other outbursts have also been missed.
Given the relatively sparse coverage, it is possible that other outbursts have been missed. Further monitoring of this object is hence encouraged.
The 2020 December outburst
Profile & duration of the outburst
The overall light curve of the outburst is shown in Figure 2. DDE 39 was detected in outburst by one of the authors (JS) on 2020 Dec 29.823 and reported to various e-mail lists.5 This was close to the start of the outburst, as ZTF had the object at 18.323r and 19.385g only 1.6 days before the detection. The object was at its brightest on detection night (2459213) at 15.1C and superhumps (discussed later) were detected, confirming this was a superoutburst of an SU UMa system. The outburst light curve was typical of many dwarf-nova superoutbursts, with an eight-day plateau phase during which there was a gradual fade; this was followed by a rapid decline towards quiescence. By JD 2459224, the star was at magnitude 19.4. Thus, the superoutburst lasted about 11 days and had an amplitude of ~ 4 magnitudes above the mean ZTF g quiescence brightness.
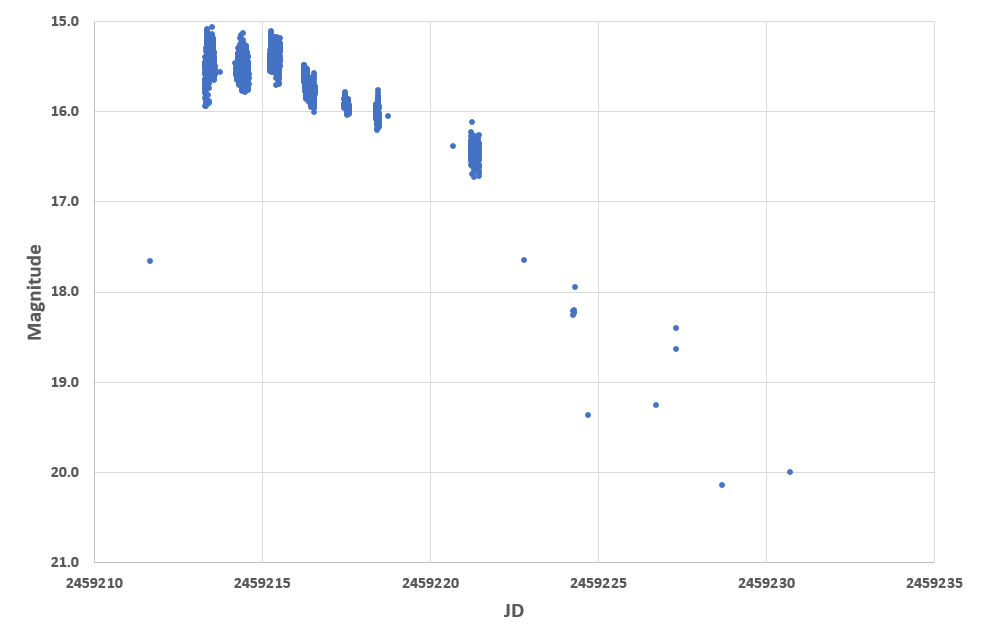
The 2018 January outburst lasted about 15 days, reaching magnitude 15.3, and was probably a superoutburst although no time-series photometry was conducted to confirm this.
Photometry & analysis
Approximately 74 hours of unfiltered photometry was obtained during the outburst using the instrumentation shown in Table 1 and according to the observation log in Table 2. Images were dark-subtracted and flat-fielded prior to being measured using differential aperture photometry, against AAVSO sequence X22572ATS. Given that the observers used different comparison stars and instrumentation, including CCD cameras with distinct spectral responses, small systematic variations are likely to exist between observers. However, since the main aim of our research was to look for time-dependent phenomena, we do not consider this to be a significant disadvantage. Heliocentric corrections were applied to all data.
Expanded plots of the time-resolved photometry are shown in Figure 3.
Measurement of the superhump period
As noted above, superhumps were detected on the first night of observations (JD 2459213) with a peak-to-peak amplitude of 0.4 magnitudes. Superhumps were present over the following five nights, although the amplitude was much smaller on the last night of time-resolved photometry, being 0.2mag on JD 2459218. On subsequent nights, the system was too faint for reliable time-resolved photometry.
(Login or click above to view the full illustrated article in PDF format)
| The British Astronomical Association supports amateur astronomers around the UK and the rest of the world. Find out more about the BAA or join us. |