Photometry of low-amplitude slow rotators: the Hilda-group asteroid (1269) Rollandia
2023 December 12
Photometry of images of asteroid (1269) Rollandia taken by seven observers at its 2018–’19 apparition has been performed using Astrometrica software and the UCAC–4 catalogue. Observed phase angles spanned 0.1–16.5° and a magnitude range of 13.7 < V < 15.2. An unambiguous synodic rotation period of 59.73 ± 0.03 hours was derived for each of the independent V and R datasets based on a double-peaked light curve. The V and R composite light curves exhibited amplitudes of 0.15 ± 0.02 and 0.13 ± 0.02 mag, respectively. Both V and R phase curves were accurately modelled using the H–G1–G2 phase function of Muinonen et al. (2010), with RMS photometric residuals of ±0.013 mag in V and ±0.017 mag in R. The following parameter values were obtained: V passband; H = 9.054 ± 0.017, G1 = 0.683 ± 0.054, G2 = 0.232 ± 0.034; Rc passband; HR = 8.625 ± 0.016, G1 = 0.713 ± 0.052, G2 = 0.234 ± 0.032. The G1 and G2 values are indicative of a D-type asteroid. The results show the asteroid may be marginally bluer at opposition: V–R = +0.429 ± 0.020 compared to a value of +0.465 ± 0.015 at α > 5°, and exhibit a slightly larger Opposition Effect in V of 0.03 mag compared to 0.02 mag in R. A very poor fit to the observed data was obtained using the two-parameter H–G phase function of Lumme & Bowell (1989), especially at low phase angles. JPL Horizons photometry of asteroids is currently based on the H–G system and appears to have poor accuracy compared to observations reported here. We find that JPL magnitudes exhibit biases spanning a range of 0.20 mag for this object, the largest deviations being at very low phase angle (α < 1°).
Brightness measurement of asteroids using absolute photometry
The traditional approach for observing asteroids is to carry out a time series of images that is long enough to show some change in their brightness. If this is done for a number of nights, then it is possible to knit together each set of data on a master ‘composite light curve’, provided the rotation period of the asteroid is known, or can be correctly identified from some form of period analysis of the magnitude data. Typical corrections for changing phase angle, α, are generally based on assumed H, G parameters with G = 0.15, which at low phase angles is a poor fit. Also, many observers, in an effort to maximise signal-to-noise ratio, do not use filters, especially if objects are relatively faint. This approach works well for asteroids having relatively short periods (<24h), but is impractical when objects rotate especially slowly.
In this article, we demonstrate an approach using filters to derive accurate standard magnitudes in Johnson V and Cousins R photometric systems. If the absolute value of V or R (i.e. not a differential magnitude) can be measured to an accuracy of, say, 0.03 mag or better, a more complete analysis of the data can be conducted: one that permits the rotation period to be correctly identified (especially where this may be very long), and also the extent of the Opposition Effect to be quantified.
Asteroid (1269) Rollandia is a case in point. Looking at the literature, there have been 11 different rotation periods proposed during 2011–2021, as listed in Table 1. Most recently, Romanishin (2021) concluded that none of the previous periods were correct but that a period of several days is quite possible.1 He commented that finding the correct period might well require a lot of time coverage from a number of telescopes at different longitudes. The current work demonstrates that Romanishin’s hunch was right, in that none of the published values are correct. Reasons for such misidentifications include: (a) this object only exhibits a small (<0.15 mag) variation in brightness as it rotates; (b) each observer has completed relatively few observing runs; (c) it turns very slowly, completing a single rotation in 59.7 hours (making it very difficult to match up sections of its rotational light curve when each observing run only lasts a few hours); and (d) the object rotates two times in 4.98 days, which means that observation from a restricted range of geographic longitude tends to sample only a fraction of the complete light curve, unless long observing runs are possible.
The observing methodology used here takes advantage of the change in brightness over a long time frame, during which the asteroid gradually brightens as it approaches opposition and then fades, largely retracing its earlier brightness trend. If we think in terms of ‘mean magnitude’, i.e., the average over a complete rotation, this brightens as the Sun–asteroid–Earth angle (phase angle, α) decreases, and follows a curve that is characteristic of the albedo and light-scattering properties of the surface regolith of each body. We call this the phase curve.
Provided that the heliocentric latitude of the asteroid changes by <5° between the start and end of the observed apparition, the aspect as seen from Earth will remain much the same and so the pre-opposition phase curve will match the post-opposition branch. In contrast, objects in highly inclined orbits can move so far above and below the ecliptic that they are seen from sufficiently different aspects as to change the shape of the rotational light curve, or change the slopes of the pre- and post-opposition sections, complicating the photometric analysis. Likewise, significant changes in aspect often occur when observing near-Earth asteroids.
BAA Asteroids & Remote Planets Section observing campaigns
In this work, instead of performing a small number of long observing runs, the aim has been to determine accurate Johnson V and/or Cousins R magnitudes predominantly from a large number of very short runs, spread over a much longer time interval than would normally be the case. In this way, it is feasible to use not only home observatories but also remotely-controlled telescopes to capture just a few images, sufficient to measure the magnitude with suitable precision (±0.025 mag or better). Each short time series then yields one data point on the composite light-curve plot/phase curve.
The Section’s asteroid photometric observing campaigns involve the study of many different taxonomic classes of asteroids, not only to derive an unambiguous rotation period but also, more importantly, to determine the exact shape of its phase curve down to very low phase angle. For each, Section members follow objects from many weeks before opposition to many weeks afterwards: the longer the time span the better. But above all, we aim to catch these minor planets very close to opposition – in fact our target is α < 0.20°. Access to remotely-controlled telescopes at locations around the world is crucial for guaranteeing success in this aspiration, since it is unrealistic to expect any one location to have clear skies during the crucial time interval when objects pass close to opposition. Also, objects close to Earth (<1au, say) have a rapid apparent motion and may remain near opposition for just a few hours, in which case they may only be visible at that time from certain longitudes on Earth, necessitating the use of a remote telescope at some suitable location.
Characteristics of (1269) Rollandia
Rollandia is a dark asteroid and member of the Hilda group, located towards the outermost region of the Main Belt. Discovered on 1930 Sep 20 by Soviet astronomer Grigory Neujmin at the Simeiz Observatory on the Crimean peninsula, it was named after French writer, Romain Rolland. It measures a little over 100km across and is in gravitational resonance with Jupiter; it orbits the Sun three times for every two orbits of Jupiter. Table 2 lists some of its physical and orbital characteristics. Classified as a D-type (Tholen and Bus–DeMeo), it has a low albedo and a featureless spectrum – neutral to reddish <0.55μm, very red >0.55μm and levelling out at >0.95μm, i.e., similar to the red-type Trojan asteroids.
2018–2019 observing campaign
Seven observers participated in the observing campaign, as listed in Table 3. One colleague, Martin Cole, has sadly died and a short tribute to him is included here as Appendix A.
All images were processed using flat fields and dark-subtracted prior to photometry with Astrometrica. The campaign proved especially successful thanks to access by RM to the Las Cumbres Observatory (LCO) worldwide network of telescopes.
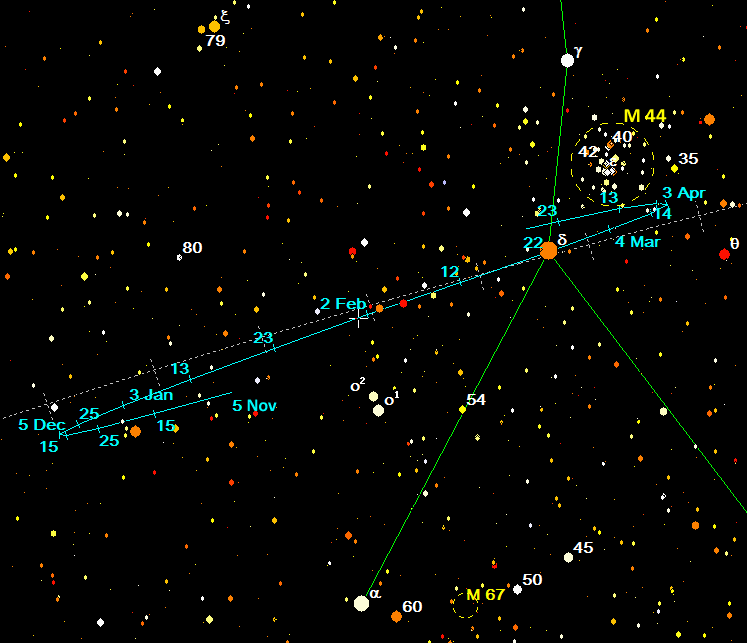
The path of Rollandia during the times when it was observed is shown in Figure 1. It reached opposition in Cancer, not far from the Beehive open cluster (Messier 44), on 2019 Feb 2, passing through a phase angle of 0.044° whilst at a distance of 2.551au from Earth and 3.537au from the Sun.
As seen from the asteroid at the time of opposition, the disc of the Sun would have subtended 0.075°; this value is the minimum effective phase angle since smaller angles would have meant the asteroid entering the Earth’s penumbra as cast by the Sun! In effect, an Earth transit on the solar disc would have been ‘seen’ from the asteroid. Images closest to opposition were obtained on 2019 Feb 02.15 using a 1.0m ƒ/8 Las Cumbres Observatory telescope sited at Cerro Tololo, Chile. Figure 2 illustrates the motion of Rollandia relative to neighbouring stars several hours after reaching opposition, where the earliest image was taken at a phase angle of 0.138°.
Photometric analysis
Plate solutions in Astrometrica software (v.442) were performed using ensemble photometry, usually of several tens of reference stars. Here, the UCAC–4 reference catalogue has been employed incorporating the AAVSO APASS catalogue (Data Release 6) of photometry in B, V, gʹ, rʹ and iʹ passbands. The photometric observations have been converted to ‘reduced’ magnitudes (adjusted to a standard heliocentric distance and range of 1au) and plotted to produce phase curves in V and R, as shown in Figure 3. Each data point is usually an average of measurements from several images, or from ‘tracked and stacked’ frames using Astrometrica. [When stacking frames for photometry, it is best to do this at half the average rate of motion of the mover, since then the PSF of the stacked star images will be essentially the same as that of the asteroid.] One observer (Steve Arnold) did not use a filter and so his measurements have not been included in Figure 3.
Averaging CCD frames or sets of data lowers random errors, such as those arising from photon noise, but this does nothing to reduce systematic bias since frame zeropoints depend on which reference stars are used as well as the accuracy of their catalogue magnitudes.
The Cousins Rc magnitude returned by Astrometrica is calculated as: Rc = rʹ – 0.152*(J–K) – 0.152, where the J–K colour index is obtained from the 2MASS catalogue (Skrutskie et al., 2006). When no (J–K) value is available, Astrometrica uses the relationship R = rʹ – 0.22. Only stars within a colour range similar to that of asteroids and comets are employed, namely 0.2 < (J–K) < 0.8.
Second-order polynomial curves are shown fitted to the V and Rc data in Figure 3. Here you can see from the scatter in the data that the amplitude of the variation due to rotation is less than ±0.1 mag, and so given this low amplitude and the large number of data points, the curves fitted are likely to be close to the true phase curves. Also, the Opposition Effect at low phase angle, though small, appears more marked in V than in Rc (~0.03 mag and ~0.02 mag, respectively).
(Log in to view the full illustrated article in PDF format)
| The British Astronomical Association supports amateur astronomers around the UK and the rest of the world. Find out more about the BAA or join us. |