Searching for lunar domes in the Sinus Iridum region: identification of a dome termed L1
2021 March 28
Introduction
Volcanism is a fundamental process in the geological and thermal evolution of the Moon. Early studies have used geological, petrological and remote sensing data to define and characterise deposits and features associated with lunar volcanism,1 and to model the ascent and eruption of magma.2 Lunar domes are the best evidence of volcanic activity in the Moon. Most have a very low angle of inclination; only a few degrees at most. This makes domes similar to Earth’s shield volcanoes, formed by outpouring of magma from a central vent (effusive eruption).3–5
Detailed study of lunar domes is possible based on images of the lunar surface acquired under oblique illumination conditions for maximum detail. The classical Lunar Orbiter image archive hardly contains any such images, while nearly all images by the Clementine spacecraft were taken at local lunar noon, which is the best configuration for spectral studies. Chandrayaan-1 and the Lunar Reconnaissance Orbiter (LRO) provide partial coverage of the lunar surface at oblique illumination, but only a small fraction of the known lunar domes are favourably imaged. Most lunar domes are discernible in the topographic maps acquired by the laser altimeters LALT and LOLA on board the Kaguya and LRO spacecraft. However, they cannot be unambiguously identified as lunar domes based on such data alone. As a consequence, ground-based images obtained using telescopes and CCD cameras like those commonly used by well-equipped amateur astronomers are of great value for the morphologic and morphometric analysis of lunar domes.
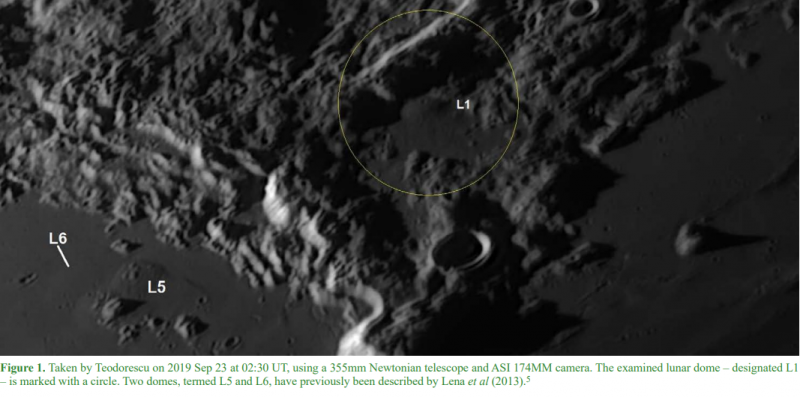
Maximilian Teodorescu, from Romania, has imaged a volcanic dome with a pit crater on the summit, located near Promontorium Laplace (Figure 1). We term this volcanic construct ‘L1’, to be consistent with previous classification for the Sinus Iridum region. It lies at coordinates of 48.57°N and 26.37°W, about 36km south-east of the crater Maupertuis, and has a base diameter of 7.6 ± 0.3km. The examined dome, which is not reported in the revised lunar catalogue by Kapral & Garfinkle (2005),6 is clearly detectable under an oblique solar illumination angle (as shown in Figure 1), demonstrating that it must be imaged close to the terminator. It lies in a circular region mapped as an ‘Im’ unit (which denotes Imbrian mare material) in the rasterised version of the 2013 edition of the I-0703 Wilhelms Geologic Map of the near side, mapped at a scale of 1:5,000,000 and ranging from –64 to 64° latitude and –70 to 70° longitude.7 A selection of further images of the examined dome is reported in Figure 2. We examine the morphometric and spectral characteristics of L1, providing a geological interpretation of our data. Finally, the goal of this study is to demonstrate how high-resolution CCD imagery of the elusive lunar domes is useful for the recognition of non-catalogued examples.
Morphometric & spectral properties
According to the LOLA digital elevation model (DEM), the dome has a height of 100 ± 10m (determined in the E–W direction), resulting in an average flank slope of 1.5 ± 0.1°. Note that the most elevated part of the surface section covered by the DEM (in the N–S direction) has a height of 230 ± 20m, resulting in a slope of 3.4 ± 0.3°. The edifice volume is estimated at 5.5km3, assuming a parabolic shape. It is located adjacent to highland soil. The 3-D reconstruction using a WAC mosaic draped on top of the global WAC-derived elevation model (GLD100) is shown in Figure 3. A possible pit crater of about 1km diameter is present on the summit. According to the LOLA DEM, it has a depth of 100 ± 10m.
Spectral data have been obtained using the Chandrayaan-1 Moon Mineralogy Mapper (M3), an imaging reflectance spectrometer that can detect 85 channels between 460 and 3,000nm. The spectrum of the dome (Figure 4) displays a narrow trough around 1,000nm, with a minimum wavelength at 970nm and an absorption band at 2,000nm, corresponding to a typical high-Ca pyroxene signature,8 and indicating a basaltic composition.
The highland to the north of the dome displays a spectrum of more feldspar composition, lacking any observable mafic absorption feature in the range between 1,000 and 2,300nm. Thus the dome consists of mare material, which suggests the interpretation that this feature is not merely an elevated deposit of hummocky material.
Figure 5 displays the spectra of L1 and Mare Imbrium (48°N, 24°W) with similar absorption bands, demonstrating the basaltic composition of the examined dome.
The spectra of major lunar minerals exhibit absorption bands that differ by their shape and position along the spectral domain.8 Pyroxenes (orthopyroxenes and clinopyroxenes) have two absorption bands: one centred near 1,000nm and another near 2,000nm. Olivine has a complex absorption centred over 1,000nm, with no absorption at 2,000nm. Therefore, olivine-rich lunar deposits are characterised by a broad 1,000nm absorption band which is enhanced relative to the weak or absent 2,000nm band.
Accordingly, the difference in composition between L1 and the highland soil is confirmed by the abundance maps created from topographically-corrected Mineral Mapper reflectance data, acquired by SELENE/Kaguya (Figure 6).9
Figure 6 displays the abundance in wt% of plagioclase and clinopyroxene content for the examined highland and L1 dome, using Mineral Mapper reflectance data extracted using the QuickMap LRO global basemap (target.lroc.asu.edu/da/qmap.html).The resulting map confirms that L1 has a different composition, consistent with a basaltic make-up.
The lava of L1 is characterised by a moderate R415/R750 of 0.5759, indicating low-to-moderate TiO2 with a high-FeO content estimated at >20wt%, based on spectral data acquired by SELENE/Kaguya.9
(Login or click above to view the full illustrated article in PDF format)
https://britastro.org/wp-content/uploads/2021/03/lena1.PNG
| The British Astronomical Association supports amateur astronomers around the UK and the rest of the world. Find out more about the BAA or join us. |