Spectroscopic observations of SS Cygni
2013 November 29
As those who follow reports of their outbursts in this Journal may recall, a dwarf nova comprises a very small, dense, hot white dwarf star whose strong gravitational field is drawing gas, mainly hydrogen, from a closely orbiting cooler and larger red star. This gas forms an accretion disc around the equatorial plane of the white dwarf. The newly arrived gas at the outer edge of the disc gradually migrates through the disc and eventually accretes onto the surface of the white dwarf.
Occasionally the density of gas in the disc increases to the point that its temperature rises rapidly and the disc becomes very bright for a few days. The star (because we can only ever see an unresolved single point of light) increases in brightness by several magnitudes: we say the dwarf nova has experienced an outburst. Eventually conditions in the disc settle down, its temperature falls, and the star slowly fades back to its normal brightness.
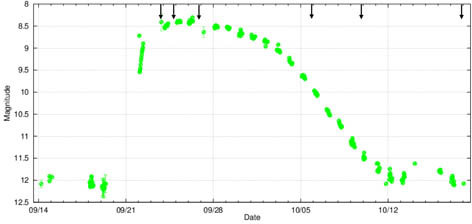 The dwarf nova SS Cygni was reported rising in such an outburst at V magnitude 9.54 on 2013 Sept 22.1. The outburst peaked at mag 8.4 about three days later and then, over the next three weeks, gradually faded back to its quiescent level at mag 12.
The AAVSO V-band lightcurve of the outburst is shown at left (in which dates are given in the American convention of MM/DD). These photometric observations record the dwarf nova’s varying brightness during the outburst but reveal relatively little about its changing physical state. With spectroscopy however, it is possible to study these changes in greater detail as the outburst progresses.
I obtained my first spectrum of the star using a LISA spectrometer on a C11 scope on September 23.906. At this time it was at mag 8.5 and approaching the peak of the outburst. I recorded a further 5 spectra to monitor how the dwarf nova spectrum changed as the outburst progressed and the star returned to quiescence. The times of these spectra are marked by arrows at the top of the lightcurve above. A compendium of these spectra is shown below in which the horizontal axis represents the wavelength in Ångstroms and the vertical axis shows relative intensity. The individ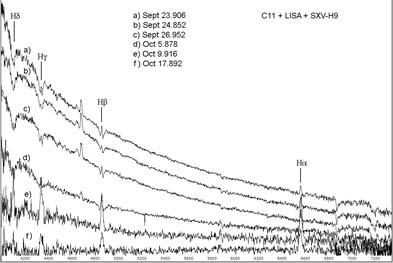 ual spectra have been separated vertically to make it easier to see the detail.
At the height of the outburst the spectrum increased strongly at shorter wavelengths, indicating the high temperature of the bright disc. The Balmer emission lines (labelled Ha to Hb) from the ionised hydrogen gas in the disc were relatively weak at the peak of the outburst with several of the lines immersed in broad absorption features caused by the opacity of the dense, hot gas in the disc. As the outburst progressed the slope of the spectrum reduced as the temperature of the disc dropped. The absorption around the Balmer lines disappeared as the opacity of the gas reduced and consequently the emission lines became more visible. As the outburst ended the Balmer lines remained relatively strong showing that the gas in the disc was still hot.
During quiescence these lines slowly reduce in strength as the disc gradually cools. The emission line between Hb and Hg visible during the early part of the outburst is probably the He II ionised helium line at 4686Å. The increase in noise in the later spectra is due to the reduction in flux by a factor of almost 100 as the outburst faded.
David Boyd, West Challow Observatory, Wantage, Oxfordshire. [davidboyd@orion.me.uk]
| The British Astronomical Association supports amateur astronomers around the UK and the rest of the world. Find out more about the BAA or join us. |