The 2018 opposition of Mars & the global dust storm : Part 1
2022 October 6
The perihelic opposition that occurred on 2018 Jul 27 at areocentric longitude (Ls) 219° was monitored by 121 observers, yielding nearly 9,000 observations. Part I of this paper focuses upon the global dust storm that arose on 2018 May 30 in early southern spring, at Ls = 184°. The event was unprecedented in having commenced in the northern hemisphere, and the process of encirclement (over 25 days) was unusually slow. The expansion of the storm in both the northern and southern hemispheres was faster to the east than to the west. Its effects were still apparent in mid-August, and there were striking and long-lasting albedo changes including the reappearance of Phasis, the unprecedented distortion of the N. part of Margaritifer Sinus – Oxia Palus, and the intensification of Indus at SE Mare Acidalium – Niliacus Lacus. The global storm deposited dust upon the S. polar cap, accelerating its early recession, though the majority of the recession curve followed that of 2003 (a year without an encircling storm) extremely closely. Other global storm phenomena included terminator projections – due to suspended dust – up to some 80km in altitude, increased activity of the N. polar hood, and the presence of a bright morning limb cloud arc adjacent to the S. polar cap. Dust velocities of up to 118km/h were measured. In Part II, other local and regional dust storms are described, as well as white cloud activity and the behaviour of the polar regions.
Introduction
This paper, continuing from our 2016 report,1 covers 2017 September to 2019 June (Martian Years (MY) 34 to 35).2
Mars was at opposition in Capricornus on 2018 Jul 27, at areocentric longitude (Ls) 219°: the first of the new perihelic approaches. The disc diameter was 24.2ʺ, while at closest approach on Jul 31, it reached 24.3ʺ. The declination (–25.5°) greatly favoured southern observers, but became favourable to northern ones late in 2018. The disc diameter was 6ʺ or more from 2018 mid-February till 2019 early February. The most seasonally comparable post-1890 oppositions were 1892, 1907, 1924, 1939, 1954, 1971, 1986 and 2003. The closest match was 1939 (Ls = 215°). Reports upon many of these are available online.3
At opposition the latitude of the sub-Earth point (De) was –11.1°. Until early 2018, early-March observation of the planet’s northern hemisphere was favoured; after that, and up till 2019 mid-May, the southern hemisphere was tilted towards Earth. Seasonal data are given in Table 1.
D. A. Peach made extensive use of the remote Chilescope facility, with an observing trip to Barbados in the first half of May. The writer spent three weeks of August in the Czech Republic, taking the optics of a 254mm reflector. Other members have described observing trips or personal research.4–6
UK-based observers had serious issues due to the planet’s low altitude, but D. L. Arditti and N. J. Haigh acquired useful images of the developing global dust storm, and post-opposition work by M. R. Lewis attained high resolution. Good seeing around opposition was rare, but if the air flow was laminar one could make out a lot of detail visually, while the usual image enhancement and stacking routines proved effective. The Director made 123 sketches between 2018 Jan 7 and 2019 Mar 28.
In Europe, C. E. Pellier experimented with spectroscopy. Further afield, C. Foster, P. Gorczynski, T. Kumamori, P. W. Maxson, E. Morales and K. Yunoki each secured more than 400 individual images (Foster over 700), while over 250 drawings came from M. Adachi in Japan. Apparition maps were submitted by P. G. Abel, Foster, R. Heffner and Peach.
8,981 observations (8,134 images and 847 drawings) were made by 121 observers in 28 different countries (Table 2). The first image was taken by R. Iwamasa on 2017 Sep 26 (Ls = 066°), the first drawing by Adachi on Nov 2, the final image by R. Hillebrecht on 2019 Jun 29 (Ls = 046°) and the final drawing by G. Adamoli on Jun 13. An interval 95% the length of a Martian year was covered, from N. late spring in MY 34 (which began on 2017 May 5) till N. mid-spring in MY 35.
The distribution per month (days observed/possible) was: 2017 Sep 2/30, Oct 11/31, Nov 26/30, Dec 30/31, 2018 Jan 31/31, Feb 27/28, Mar 31/31, Apr 29/30, May 30/31, Jun 30/30, Jul 31/31, Aug 31/31, Sep 30/30, Oct 31/31, Nov 30/30, Dec 31/31, 2019 Jan 30/31, Feb 26/28, Mar 26/31, Apr 20/30, May 18/31, and Jun 5/30.
The ExoMars spacecraft began imaging in 2018 April.7 On 2018 Nov 26, long after opposition, the suite of spacecraft working upon Mars or in orbit around it was augmented by the arrival of NASA’s InSight lander at SW Elysium Planitia at +4.5°, 224.1° (or telescopic SE Aethiopis).8,13 It landed on smooth terrain and deployed its seismograph station and thermograph tool to take the planet’s subsurface temperature. Mars Reconnaissance Orbiter (MRO) continued its daily meteorological monitoring.9
Observing tips were published by the Director in the Journal,10 as well as in popular magazines.11 Two interim reports appeared,12,13 while a regular illustrated ‘blog’ was maintained at the new Section website. (The latter had recently been migrated from a previous web address and updated.14) The Director was interviewed for the monthly BBC Sky at Night Magazine podcast about using images for research.15
The ALPO Japan (JALPON) website has become the most widely supported for online archiving,16 while the OAA Mars Section (Japan),17 ALPO (USA),18 SAF Mars Section,19 and PVOL websites also archive online.20 However, the writer is not aware of any organisation other than the BAA that has produced post-2007 apparition reports.
The observations
General
For nomenclature we use Ebisawa’s telescopic map.21 East and west are aerographic, where the planet’s E. limb is the preceding (p.) one, and longitudes are in degrees west of the zero meridian.
In Part I we review the global dust storm of 2018 and its effect upon albedo features. Lesser dust storms, white clouds and the polar regions will be discussed in Part II. De and Ds (the latitude of the subsolar point) momentarily coincided in 2018 mid-July at –13°, but the global storm eliminated any chance of checking for the incidence of any specular ‘flash’ from the planet’s surface.
Albedo features
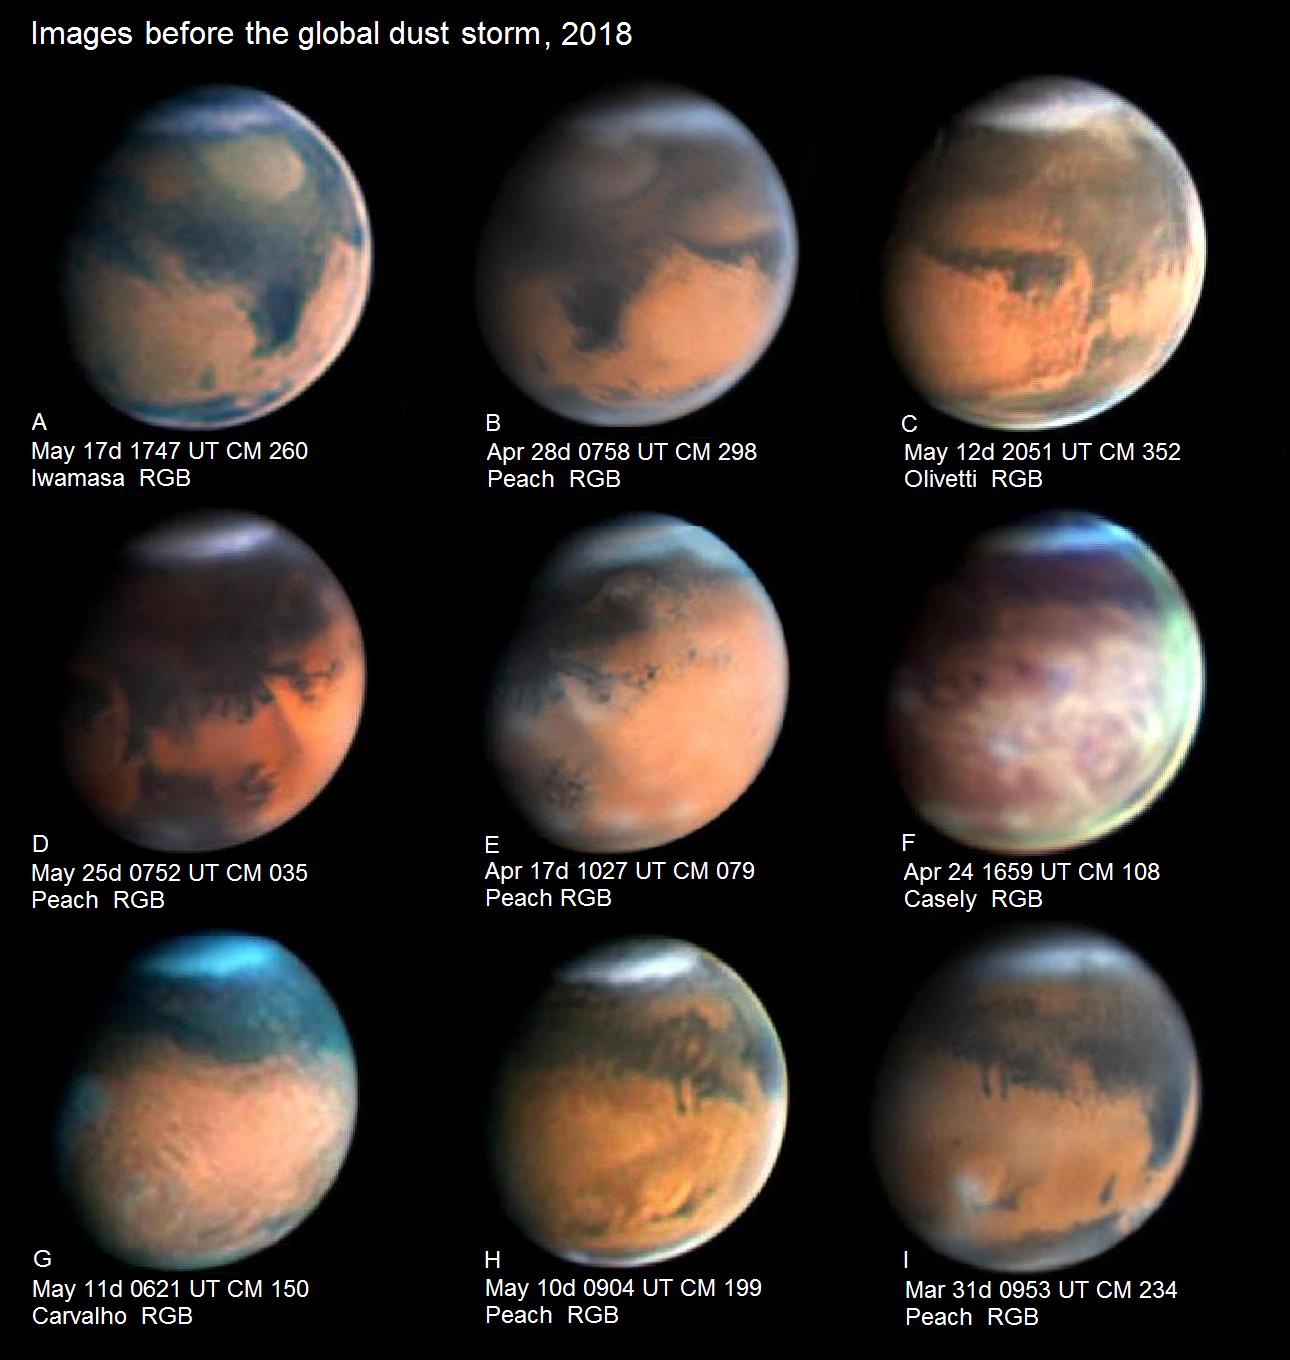
With the small exceptions below, prior to the 2018 global storm the albedo features (Figure 1) precisely matched 2016.1 Many changes were caused by the storm, and several proved remarkably persistent, existing even in 2021.22,23
Region I: long. 250–010°
Late in the 2016–’17 apparition,1 a large Regional dust storm had caused a darkening of Mare Serpentis and Pandorae Fretum. These areas were still well marked upon the 2017 December images by Miles and Wesley, but Pandorae was already faint by 2018 Jan 20 (Kumamori), and its faintness persisted (see Olivetti’s image of May 12 (Figure 1C)). However, Mare Serpentis (extending into and darkening E. Noachis) remained prominent up till the global storm (Figures 1B & C).
Region II: long. 010–130°
Baetis, which joins Juventae Fons to Aurorae Sinus, looked rather broad at low resolution, as it was in the last few apparitions. At high resolution a short dark streak paralleled its N. border to give the impression of a short, double ‘canal’ (Figures 1D & E). The little projections to the north of Aurorae Sinus and along the S. border of Chryse were again very conspicuous (Figures 1C–E). Already at the previous opposition, Oxia Palus had exhibited a long drawn-out N. tip, while the thin Indus ‘canal’ running NW from the western side of Oxia Palus reached S. Mare Acidalium/Niliacus Lacus (Figure 1C–D): these features would change substantially as a result of the global storm.
Ganges was again broad, but the sharper W. border compared to 2016 gave it more prominence. Its tone was uniform, with no sign of the darker edges that it sometimes exhibits (Figures 1D & E).
Region III: long. 130–250°
As in several oppositions up to 2016, a bright yellow patch (pink to some eyes) of dust fallout remained visible in the NW of Elysium, adjacent to the Aetheria secular dark feature. This surprisingly enduring feature (Figures 1G & H) could still be traced, though slightly faded, and it persisted until covered by the global storm.
The Martian atmosphere
The 2018 global dust storm
Introduction
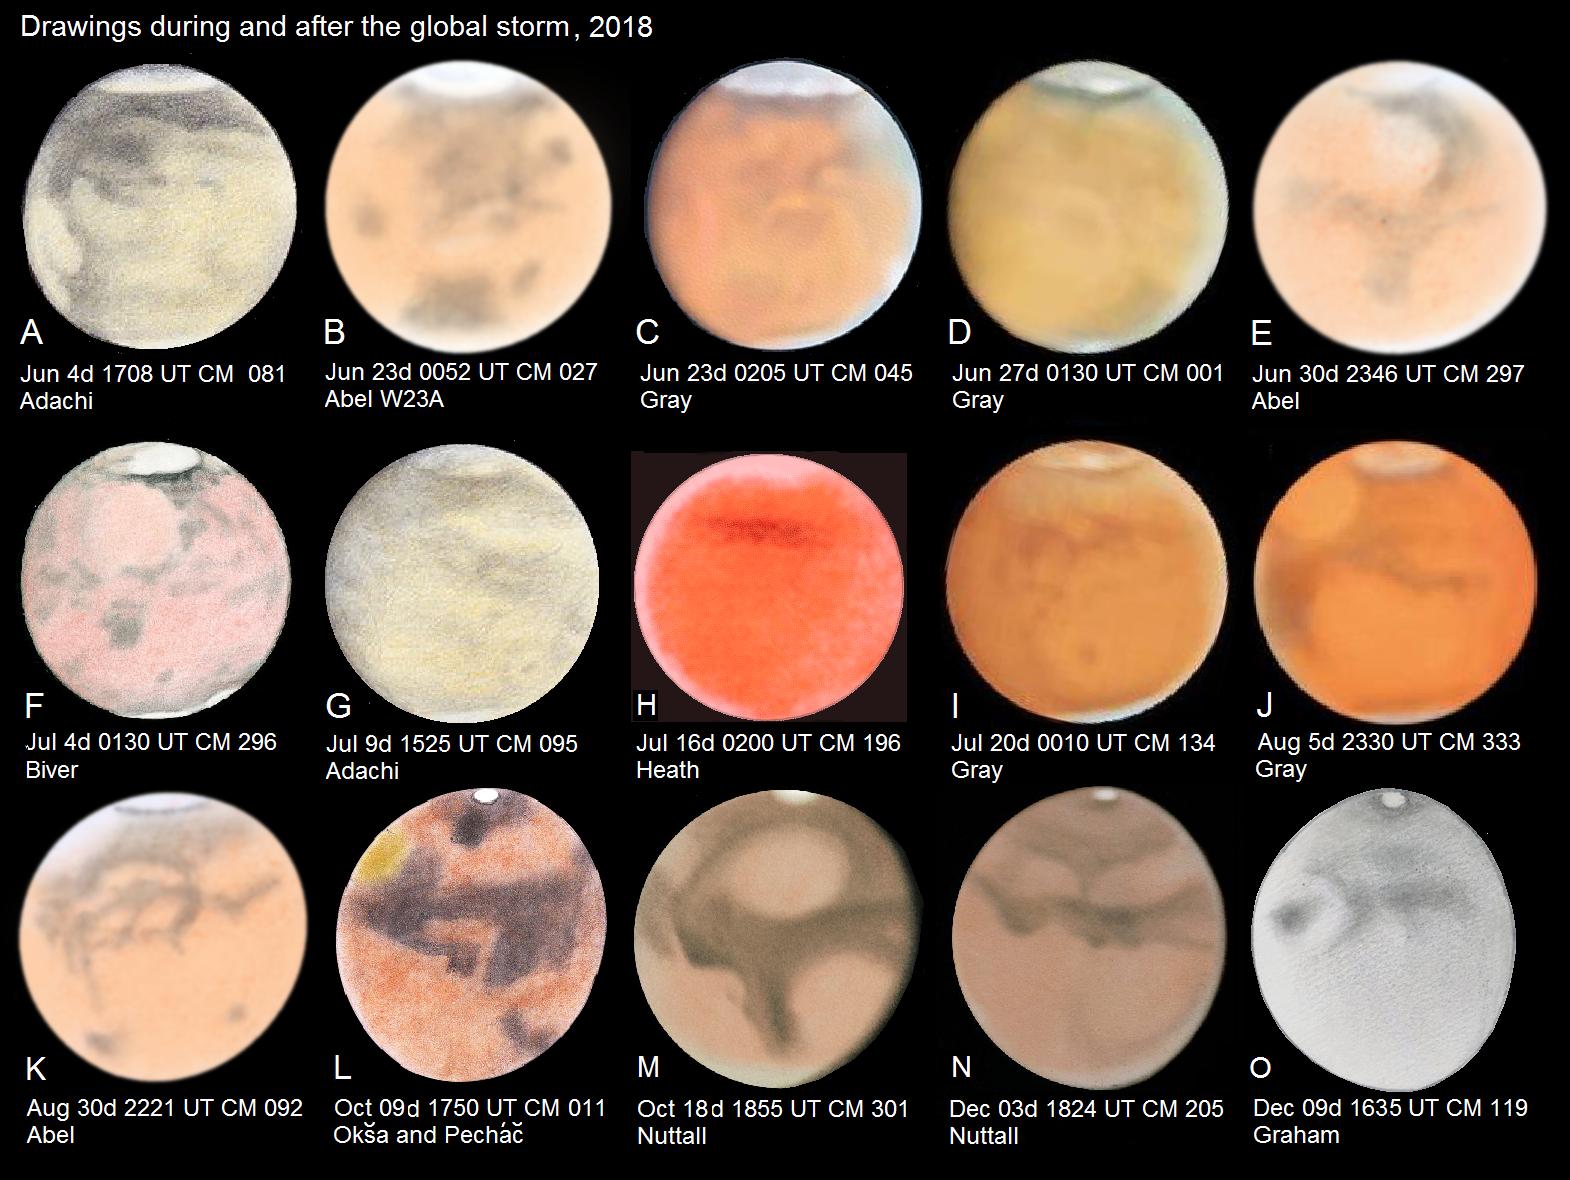
Many imagers tend to exaggerate contrast during major obscuration events, so visual impressions provide a reality check. The drawings of Figure 2 introduce the event; drawings by the Director of the storm and its aftermath appear in Part II, Figure 13. Morales (Puerto Rico) on May 30 (Ls = 184°) took the first image to show the storm,12 but Rueck (USA), after imaging it on the following day, was the first to announce it on an online forum. The Director alerted active observers by e-mail on Jun 5, when it was clear that it was not merely a small Regional event, and issued BAA e-Bulletin no. 1007 (Jun 10). Commencing in SE Mare Acidalium–Niliacus Lacus, in the northern hemisphere, the Director did not at first believe it could become encircling.
As always, dust was recognised by its brightness in near-infrared (IR) and red (R), moderate brightness in green (G), and obscurity in blue (B). A wide range in image processing was in use, and we have generally avoided including the highly contrast-enhanced IR images that some contributors produce, except where available R or RGB composite images would not have given a sufficiently clear indication of particular features. Occasionally the Director composed IR–RGB images as a compromise. We have chosen sets of images to represent each successive rotation for the first four weeks until Day 28, Jun 26–27 (Figures 3–6), and then less frequently while the event decayed. Naturally, there are occasional gaps and occasionally we had to include lower resolution work. In each complete row, the storm’s origin is located around or just right of centre. A token attempt was made to make images within each row a similar size and brightness, and to reduce large variations in contrast. Maps for selected dates appear in Figure 7.
Encirclement can only occur as the result of the merging of the primary dust core with other cores at different longitudes. For a long time in the case of the 2018 storm, no secondary core appeared: coupled with the event’s unusually slow progression in longitude, a slight decay was even suspected in some areas. But then on Day 22, another core appeared at Solis Lacus (and environs) after which its expansion ultimately led to encirclement on Day 25. From the global maps (Figure 7), it was estimated that the dust did not spread north of latitude +54°. This is similar to another estimate.24 The S. polar cap was considerably affected by dust, but never completely covered.
Daily descriptions up to encirclement (Day 25)
May 27: An inclined yellowish-white band oriented Np. to Sf. (not present the previous day, and contrasting with the bluish N. polar hood) was located across N. Mare Acidalium; it had a bright, dusty core at the N. limb. Another inclined light band, suggesting a further front following, lay to its Nf. side.
May 30 / Day 1: The global dust storm formally began as a compact elliptical bright area, centred at ca. +36°, 018° in SE Mare Acidalium – Niliacus Lacus, with its E. end in Cydonia. There is no particular topographic feature here; the terrain merely slopes gently from SE to NW. But this was adjacent to the track of the front that had evidently moved south from the North Polar Region (NPR). (The latitude of the subsolar point (Ds) was then –2°.)
May 31 / Day 2: The location of the bright core over SE Mare Acidalium / Niliacus Lacus (Acidalia Planitia) was similar, having expanded to the SW and appearing dumbbell-shaped. Its latitude ranged from ca. +25° to +40°. There was no obvious change during three hours’ observation.
Jun 1 / Day 3: The original cloud moved south to form two discrete bright nuclei in southern Chryse; there was also some dust as far west as the E. edge of Ganges, while SE Acidalium was faded.
Jun 2 / Day 4: New dust cores appeared at Aram/Thymiamata. There was a resurgence of the original nuclei.
Jun 3 / Day 5: A dust core appeared in E. Valles Marineris at Eos, and the N. part of Margaritifer Sinus was blotted out.
Jun 4 / Day 6: To the east, dust was spreading across Eden, but its boundary was already ill-defined. On the west, dust had begun to cross Ganges. The Tharsis Montes orographic clouds disappeared.
Jun 5 / Day 7: A general expansion; dust obliterated much of Margaritifer Sinus and cut across N. and S. Ganges.
Jun 6 / Day 8: Dust expanded further east–west, moved into W. Deucalionis Regio, hid W. Meridiani Sinus and ran along Valles Marineris. There appeared to be a weak dust core in Argyre.
Jun 7 / Day 9: Central Ganges (the only part remaining) showed an anomalous darkening. The dust expanded southward to reach E. Mare Erythraeum. There was now a definite core in Argyre.
Jun 8 / Day 10: The Argyre dust was moving south towards the South Polar Cap (SPC). (Dust over the cap is further discussed separately.) Syrtis Major was not yet affected. Peach’s image showed a loss of contrast north of Syrtis, the very ill-defined E. front having passed and faded Nodus Alcyonius, with Arabia dusty towards the yellowish limb; high-latitude dust at the SPC N. edge had reached SW Hellas, though at this latitude too the dust front was not very bright.
Jun 9 / Day 11: Longitude 0° was now completely unrecognisable. Complex dust cores existed over Mare Erythraeum (though the W. part was still dark), and bright dust had travelled all along Valles Marineris (a striking development which picked out the detailed topography of the canyon) and over Noachis, while Deucalionis, Margaritifer, Meridiani and W. Sinus Sabaeus were blotted out. A small dust core had formed at Juventae Fons. Dust began to spill onto the cap and was crossing Bosporos to approach Thaumasia at its western limit. Dust was crossing southern Hellas. In the north, Mare Acidalium remained clearly visible.
Jun 10 / Day 12: Some dust from central Hellas had crossed into Ausonia as far east as longitude ~260°. A finger of dust had crossed E. Noachis/Deucalionis into S. Iapigia. Dust had filled Argyre. A new bright dust-storm nucleus had formed over E. and central Solis Lacus, with a complex pattern comprising many small cores. Dust could be seen over Tharsis.
Jun 11 / Day 13: Dust had moved east across Iapigia; N. Hellas was now full of dust. Syrtis Major had greatly faded, and only a trace of Sinus Sabaeus remained. A large fraction of the SPC had been covered.
Jun 12 / Day 14: The N. hemisphere was now widely affected around a central-meridian (CM) longitude of 200°, so that Elysium and environs were starting to fade. Dust had reached Ausonia and was crossing Mare Tyrrhenum and Hesperia. Cimmerium and Sirenum were the only major southern maria unaffected. The Solis Lacus core was fading, but a new one had appeared over Daedalia. The Hellas basin was full of dust. (Very likely further dust-raising had occurred there, but the area did not become as bright as it can on such occasions, suggesting lower activity than usual.)
Jun 13 / Day 15: The fresh Daedalia core had greatly faded, and Solis Lacus had recovered somewhat, suggesting for the moment that the storm would not develop further. Mare Tyrrhenum was starting to become obscured.
Jun 14–15 / Day 16: Dust obliterated Mare Tyrrhenum and W. Mare Cimmerium, and small patches were seen over other parts of the latter. Nothing was now visible of Elysium and its surroundings. By now, the only longitudes not affected in the south were those from west of Daedalia to the E. half of Mare Cimmerium. However, the presence of dust in the north was betrayed by the Tharsis Montes which, together with Olympus Mons, now showed up more distinctly as dark spots, their summits poking through the dust layer. They would now darken further over several days.
(Login or click above to view the full illustrated article in PDF format)
| The British Astronomical Association supports amateur astronomers around the UK and the rest of the world. Find out more about the BAA or join us. |