The five greatest sunspot groups
2021 November 30
Introduction
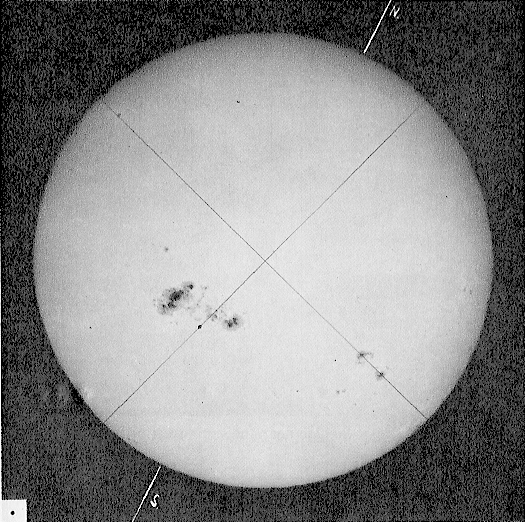
Most BAA solar observers will be aware that the largest recorded sunspot group appeared during 1947, and perhaps will know that it had an area of about 6,000 millionths of the Sun’s visible hemisphere (msh). They have probably just seen a photograph of the group, such as that shown in Figure 1.
This paper shows the white-light development of this great sunspot group,1 and four other great sunspots groups that were observed between 1946 February to 1951 May, during Cycle 18. All five groups had areas greater than 4,500msh and these are the only examples recorded with such large extents.3 Various sources of material have been used in this research, such as reports and papers from past issues of the BAA Journal, as well as solar drawings made at Mt Wilson Observatory, USA and by the Japanese solar observer Hisako Koyama, together with other material belonging to the author and available online.
The paper begins by describing Solar Cycle 18, based on the compiled BAA group mean daily frequencies, together with dates for when the five great sunspot groups occurred during the cycle. This is followed by a description of the passage of the five groups, including their appearance on previous and/or subsequent solar rotations.
Cycle 18
Based on the peak smoothed International Sunspot Number,8 Cycle 18 was the third strongest solar cycle of the 20th century (after Cycle 19 – peaking in early 1958 – and Cycle 21, peaking in late 1979). The cycle began in 1944 February, peaked in 1947 May with a smoothed International Sunspot Number of 219 and ended in 1954 April. Figure 2 shows (in blue) the average number of groups over Carrington synodic periods (approximately 27 days), from the BAA Journal.9–16 (Unfortunately, these synodic rotation averages were not included in the Journal solar report covering the period from 1950 June.16) The red curve gives the smoothed number of groups. Finally, the green vertical lines represent the dates of the five great sunspot groups – note that two of these occurred on the rise to maximum, two close to maximum and one on the latter part of the declining phase. This distribution of large sunspots within a cycle is unusual – two-thirds of large sunspot groups occur after sunspot maximum.17

The two great groups from 1946, referred to by their Greenwich numbers 14417 & 14585, are probably the same group from different solar rotations. The two great groups from 1947 –14851 & 14886 – are from successive rotations. These four great groups, together with the one from 1951, are described separately below.
Greenwich group 14417 (1946 February)
This great sunspot group appeared around the eastern limb on 1946 Jan 29 as a single, irregularly shaped penumbral sunspot at a heliographic latitude of 26°N. As Figure 3 illustrates, based on Mt Wilson drawings,17,18,19 and a photograph,20 by the next day a following penumbral sunspot appeared on the limb. When the follower sunspot had fully rotated onto the disc on Jan 31, the bipolar nature of this group could be seen, with the follower being the largest sunspot. Several umbrae were present within the two main penumbral sunspots.
On Feb 1, the group had an area of 4799msh (based on Greenwich sunspot group data).4 As it neared the central meridian, a few small penumbral sunspots and pores appeared between the two main sunspots and at the following (east) part of the group. The main umbra of the following sunspot had separated into two between Feb 2 & 5. The leader sunspot had split by Feb 6, although it appeared as one penumbral sunspot again by Feb 8. The group obtained its maximum area of 5202msh on Feb 7 (see Table 1), when it also obtained its maximum longitudinal extent of 27° (330,000km). The leader had decayed by Feb 9 and rotated off the disc on Feb 10. The follower remained on the disc for a further two days, with it last seen as a very slender sunspot near the limb on Feb 12 – its latitudinal extent remained undiminished.
Note that for Figure 3 and similar figures, the sub-image scale of drawings and photographs are all the same – approximately 30° in longitude by 23° in latitude when near the central meridian. The drawing orientation is shown in the bottom right of each figure (the rotation axis being vertical and east to the right). The Mt Wilson drawings were typically drawn at a local time of 10h or 18h UT. Figure 3 also shows differences in drawing styles and detail between Mt Wilson observers.
Figure 4 shows drawings of the passage of group 14417 by BAA member Dr Ellison, using a disc diameter of 11 inches.21 These show similar or in some cases more detail than the Mt Wilson drawings, although some days are missing due, presumably, to cloudy weather in February.
As Table 1 shows, the great sunspot returned on two subsequent rotations as Greenwich group numbers 14451 & 14478, albeit at reduced areas. Figure 5 shows the passage for the second rotation (every other day) – the largest sunspot was still the follower, with a maximum area on Mar 4 of 1741msh and a longitudinal extent of 31° (376,000km). As the group progressed towards the western limb, all the leader sunspots decayed such that on Mar 11 the area was just 850msh and there was a much-reduced longitudinal extent of just 7°. A single, small penumbral sunspot was close to the western limb on Mar 12.
On the third rotation (Figure 6), the group was much diminished and without any particular structure – it appeared as a collection of small penumbral sunspots and pores. Its total area obtained a maximum for this rotation on Apr 2, at 768msh (the group would have still been visible with the protected naked eye). On this date, the longitudinal extent of the group was 11°. Figure 7 shows the evolution of group area for the three rotations (area is plotted against central-meridian distance, with east being negative; hence time increases left to right).
(Login or click above to view the full illustrated article in PDF format)
| The British Astronomical Association supports amateur astronomers around the UK and the rest of the world. Find out more about the BAA or join us. |