The opposition of Jupiter, 1954 – 1955
2024 April 5
A report of the Jupiter Section (Director: J. H. Rogers)
After having been invisible during the previous opposition, late in 1954 the Great Red Spot darkened once more, becoming particularly prominent in 1955 January–February. The long-lived white South Temperate ovals appeared with higher contrast against the S. Temperate Zone than in 1953–’54. During solar conjunction, the S. component of the South Equatorial Belt (SEB) had faded, and in 1955 February there was another Revival of the belt, only two years and three months after the previous one, and six years after that of 1949. The 1955 Revival was less energetic than any previous known event, with moderate activity in the N. Branch (with a drift of –54 degrees per month (o/mo)) and Central Branch (–48 °/mo), and an exceptionally weak S. Branch (+61 °/mo; all figures being in System II)). Its initial longitude fell close to that of Reese’s ‘Source C’. The North Equatorial Zone contained more well-defined features, and the velocity of the North Equatorial Current increased from its 1953–’54 minimum to a normal value. Both components of the North Temperate Belt displayed obvious spots, and drifts for two different currents were measured: a fast one on the S. component (–104 °/mo, North Temperate Current B) and a slow one on the N. component (+21 °/mo, North Temperate Current A). Photographic and micrometric belt latitudes are presented and help to fill a large gap in continuity in the literature.
Introduction
Jupiter was very well placed for northern-hemisphere observers, coming to opposition on 1955 Jan 15 at declination +21½°. Useful work, under the directorship of Dr A. F. O’D. Alexander, was carried out by G. E. D. Alcock, B. Burrell, S. Cortesi (Lugano, Switzerland), A. C. Curtis, Miss M. Davies-Scourfield, W. H. Day, E. Epstein (Hollywood, CA, USA), V. A. Firsoff, M. Flain, W. E. Fox, J. Friends, J. A. Gould, W. H. Haas (Las Cruces, NM, USA), A. W. Heath, M. B. B. Heath, F. M. Holborn, A. P. Lenham, R. A. McIntosh (Mt. Eden, Auckland, New Zealand), P. A. Moore, O. C. Ranck (Milton, Pennsylvania, USA), E. J. Reese (Uniontown, Pennsylvania, USA), G. Ruggieri (Mestre, Italy), J. Russell Smith (Eagle Pass, Texas, USA), K. Stocker, J. E. Thrussell, H. J. Whitaker, A. P. Williams (with D .H. Malard), H. N. D. Wright, and F. C. Wykes; all were UK-based unless otherwise stated. Good series of central meridian (CM) transits were made by Alcock, Cortesi, Fox, Haas, Lenham, and Reese, with a series of detailed strip maps by Whitaker. Photographs were supplied by H. E. Dall and P. R. Lichtman (Washington, DC, USA).1 The names of Dall and A. W. Heath, who would be contributors over decades, appear for the first time.
The author has analysed all the Section records, the few photographs available from Pic du Midi Observatory (Figures 1D–E),2 and drawings by W. Löbering (Germany; Figure 1F).3 No photographs were taken at Lowell Observatory.
Contemporary reports on 1954–’55 were published by the Association of Lunar & Planetary Observers (ALPO), but with drift rates derived from too few CM transits, and by G. Ruggieri and S. Cortesi.5,6 After a very full account of the 1952–’53 apparition, no full BAA report appeared until the Memoir for 1956–’57 & 1958, but short accounts of the 1955 South Equatorial Belt Revival were given by W. E. Fox at meetings, as described in the Journal.7–8 A BAA Circular was issued,9 and an illustrated paper by Alexander discussed the correlation of Jovian radio emissions with visible features (for 1954–’55 and 1955–’56).10 Radio emissions from Jupiter were first reported during 1955, but records of earlier emissions (which only later were attributed to the planet) date from 1950.11 Some BAA average drift rates were tabulated in the Memoir,12 but this paper presents a more substantial number. German amateur reports are pertinent to this time period.13
Observations covered 1954 Aug 27 to 1955 Jun 20. Limiting solar conjunctions occurred on 1954 Jun 30 and 1955 Aug 4. This paper is a continuation of the author’s analysis of 1953–’54.14 A sequel will discuss 1955–’56.
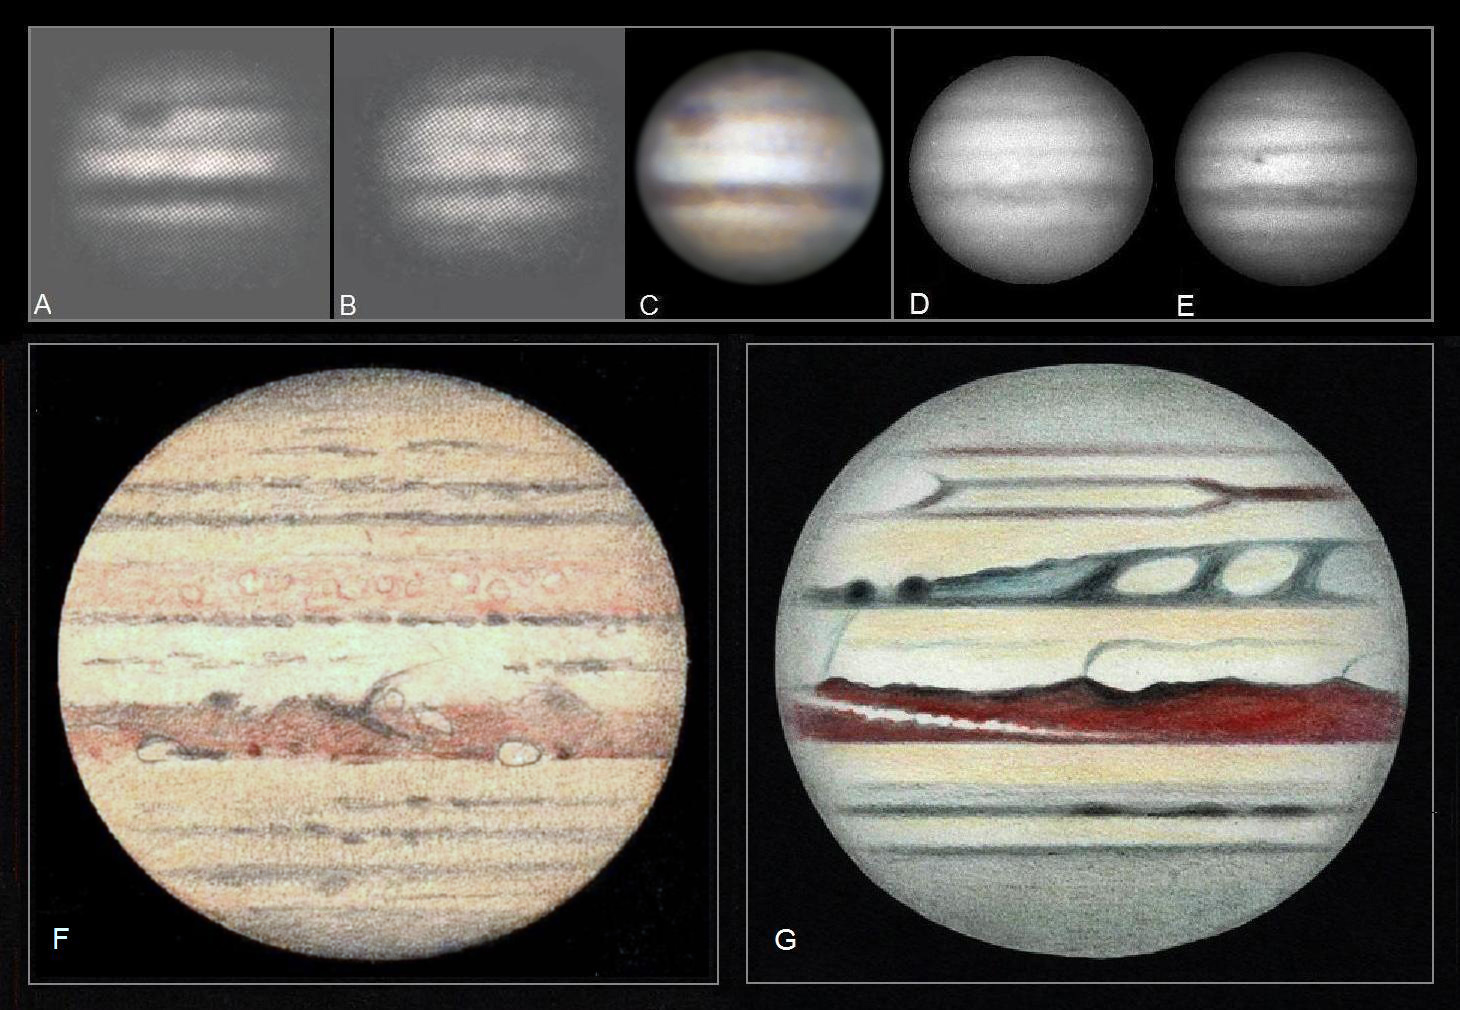
(A)–(C) Blue ((A) W47, 02:18 UT) and orange-red ((B) W23A, 02:57 UT) filter photographs by P. R. Lichtmann with 203 mm refl. with projection camera, 2–3 s on Kodak Royal Pan film, 1955 Feb 9.19 The R(G)B composite (C) prepared by E. Kardasis for 02:38 UT (CM1 = 162ׄ°, CM2 = 330°) nicely shows the GRS and NEB colorations, but is low resolution.
(D)–(E) Yellow filter photographs, taken with the 600 mm OG of Pic du Midi Observatory. (D) 1955 Mar 15, 21:50 UT; CM1 = 113°, CM2 = 016°. Note S. Temperate white oval FA. (E) 1955 Mar 18, 22:28 UT; CM1 = 249°, CM2 = 129°. The sloping p. end of the SEB Revival is approaching the CM. Shadow of Io in EZ(S). Note the lighter interior of the STB f. white oval BC in (E) and (G).
(F) Coloured drawing by W. Löbering with 265 mm refl., ×225; 1954 Nov 1, 02:58 UT; CM1 = 214°, CM2 = 065°. Note the spots upon both components of the NTB, the complex details and rift in the NEB as well as the small details within the SEBZ.
(G) Coloured drawing by G. Ruggieri with 254 mm refl., ×256; 1955 Mar 14, 20:20 UT; CM1 = 260°, CM2 = 171°. Notice the SEB Revival, the contrasting colours of the SEB and NEB, and the long, complex NEB rift.
(Note: Here and in the other Figures, south is uppermost.)
The observations
North Polar Region (NPR)
The NPR was shaded and featureless. A N. N. N. Temperate Belt was occasionally seen within it.
North North Temperate Zone (NNTZ)
The NNTZ was inconspicuous, quite dull, and not often seen.
North North Temperate Belt (NNTB)
The NNTB was moderately dark, but less so than the N. component of the NTB (see below). It frequently marked the apparent S. edge of the NPR. It contained no long-lived or well-marked features.
North Temperate Zone (NTZ)
The NTZ was fairly dull and less bright than the NTropZ. Some features from the NTB N. component projected into it.
North Temperate Belt (NTB)
This belt was almost as dark as the STB, and appeared double at most longitudes, the N. component being darkest. The N. component was continuous and showed plenty of detail over a wide range of longitudes; there were also shadings and a few dark spots between the components. A positive drift typical of N. Temperate Current A (NTC-A) was found for the N. component.
The S. component was discontinuous. From January onwards, there were several small dark spots or streaks resolved in it which showed the large negative drifts typical of the fast N. Temperate Current B (NTC-B), but none were long-lived. Despite small apertures, the longitude determinations by Alcock (102 mm OG), Fox and Reese (152 mm refls.) were among the most useful. Spots formed over a range of longitudes but were rarely observed lower than λ2 ~120°. Moreover, at least from early 1955 onwards, there existed a definite upper limit to their initial longitudes, which itself increased gradually in System II, with a velocity corresponding to that of NTC-A and corresponding in longitude to the following (f.) end of a shaded section between the belt’s components. The latter limit sometimes took the form of a ‘shoulder’ to the NTB(S), after which the belt was faint or absent. The spots were especially well observed in the longitude of the Great Red Spot (GRS).
The mean drift of the NTB-B spots was –104 °/mo, giving a period of 9h 53m 19s. The mean value up to 1948 quoted by B. M. Peek, 9h 53m 17s, is in close accord. The latitude of the centre of the NTB (Table 1) was a little further north than in 1953–’54.
Figures 1F–G, 2, 3A–E, H, 4B–C, 5A–C and 7B–C most clearly show spots upon the NTB components.
Members can view the full illustrated article in PDF format by returning to the previous page. Not a member? Why not join today?
| The British Astronomical Association supports amateur astronomers around the UK and the rest of the world. Find out more about the BAA or join us. |