Uranus during the 2016 apparition
2023 December 12
A report by the Uranus Coordinator of the BAA Saturn, Uranus & Neptune Section (Director: Mike Foulkes)
This report describes the observations of Uranus made during the 2016 apparition. Throughout this apparition, enduring atmospheric detail was observed, including distinct light zones and dark belts. A small number of spots / bright patches were observed in the North Equatorial Zone, but less frequently in other regions of the planet.
Introduction
Uranus reached opposition on 2016 Oct 15 in the constellation of Pisces, RA 1h 23m, Dec. +8.1°, approximately 2° NNW of the star μ (98) Psc. At opposition, its apparent magnitude was 5.7 and its apparent diameter 3.7ʺ. Visual and digital observations were made by 22 observers between 2016 mid-July and 2017 mid-January.
Observers
The contributing observers are listed in Table 1. All observers made digital images except those marked ‘V’ for visual observations only.
Historical perspective
Unlike the other major planets (with the exception of Neptune, for which a similar case can be made), Uranus has been a relatively neglected subject of popular or sustained observation by amateur and professional astronomers. In the last sixty years prior to the Uranus reports by Foulkes & Bailey (2014),1 and Bailey (2021),2 only two dedicated Uranus reports have been published in the Journal:3,4 in 1989 and 2000 respectively, by A. J. Hollis, Director of the late Asteroids & Remote Planets Section, and covering the period 1954–1997. Forty-one observers contributed observations during the 43 years covered by these reports, of which 26 were magnitude estimates made exclusively using binoculars. Only eight observers used instruments with an aperture exceeding 200mm. It is worth noting that David Gray, one of these veteran observers, has been contributing visual observations of Uranus regularly from 1969 up to the present day, and is arguably the most experienced visual observer of the planet still active.
With the gradual supplanting of visual observations by digital imagery since the 1990s, a handful of observers have made considerable progress recording detailed images of Uranus, notable among them being John Sussenbach, who since 2006 has consistently improved the digital view of the planet. Aspiring Uranus imagers are encouraged to read the recent Journal paper describing his Uranus work in 2006–2016.5
The author has singled out Gray and Sussenbach because they admirably represent the two methods of observing – visual and digital – that are of equal value, especially when used comparatively, to enable the confirmation of elusive atmospheric detail. This report is an attempt to ‘normalise’ Uranus as an equal among its planetary peers, and encourage amateur observers to make it the subject of regular observing and reporting.
Observing methods: visual & digital
Professional studies present a model of the Uranian troposphere with a definite vertical structure in which methane condenses as it rises – first into clouds, then into more reflective methane ice.6 Within the scope of amateur observation, it would be logical to assume that visual observers are seeing the bright methane clouds high in the Uranian troposphere (brighter still, these clouds condensing into more reflective methane ice) – whereas digital observations, using near IR filters, are probing deeper into the troposphere and identifying the more dense cloud features (and some condensation haze). With this in mind, where possible, this report has matched visual and IR observations in an attempt to present a more dynamic three- rather than two-dimensional picture of the troposphere of Uranus.
For the sake of uniformity, the drawings and images are presented ‘south up’ (as is the current BAA convention), with the north pole aligned to the left – unless otherwise indicated. In the future it may be necessary for regular Uranus observers to discuss and agree a standard method of reporting regarding the orientation of the planet.
The observations
Significant advances have been made with regard to the amateur observation of Uranus during the 2016 apparition. These are primarily the confirmation of distinct and enduring atmospheric belts and zones by multiple observers. Latitude measurements were made as precisely as possible using the software WinJUPOS, but due to the small size of digital images – and difficulty in making precise visual drawings of such a small disc – a possible error factor of 5–10° has to be taken into account. Regions on the planet’s disc are defined using the terminology established in the 2015 Uranus report:2 i.e., NPR – North Polar Region, NPB – North Polar Belt, NTZ – North Temperate Zone, etc.
The North Polar Region & North Polar Belt
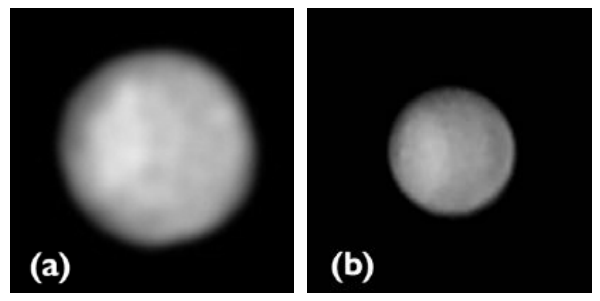
The existence of a distinct NPR was recorded throughout the apparition by both visual and digital observers, extending from the north pole to approximately lat. 75°N. Digital images by J. Sussenbach on 2016 Jul 18 (Figure 1a) and M. Guidi on 2016 Aug 15 (Figure 1b) show the NPR, and are complementary to detailed drawings (with intensity estimates shown) made by D. Gray (Figure 2a & b) on 2016 Aug 2 and 2016 Oct 2. His intensity estimates for this feature over seven observations (2016 August–November) average 4.7 on the Saturn Scale – a relatively dark feature less often recorded digitally than visually, and at present we can only speculate that this may be due to filter wavelength or processing factors.
The NPB was also recorded regularly throughout the apparition, both visually and digitally (Figure 3) – an interesting feature, often seen more clearly when the NPR was lighter. It is circumpolar and appears as a dark narrow band situated between lat. 75–65°N, with a well-defined border at 75°N separating it from the NPR. This can be seen clearly in an image taken by Milika & Nicholas on 2016 Nov 26 (Figure 3c). Maksymowicz (Figure 3a) and Bailey (Figure 3b) recorded the dark band visually. Though elusive and variable, the NPB was an enduring feature throughout the apparition – Maksymowicz recorded it in 19 of his 43 observations, and Bailey in 18 out of 26.
The North Temperate Zone & North Temperate Belt
The bright North Temperate Zone (NTZ), at approx. lat. 45–65°N, showed a great variability of texture – sometimes patchy, and at other times smooth and well defined – regardless of whether the observation was made visually, or digitally. The observations shown in Figure 4 demonstrate this, and highlight the difficulty of identifying distinct features in the NTZ, for although they undoubtedly exist at times (as evidenced by the NTZ bright spot of 2014), matching two or more observations to confirm their existence and movement remains rare, due to the infrequency and small number of observations to compare – despite the NTZ being the most frequently recorded feature on the planet.
The North Temperate Belt (NTB), at lat. 45–20°N, remained dark and unremarkable during this apparition, mottled occasionally with indistinct light markings that appear almost exclusively in digital IR images, and therefore may be processing artefacts.
(Log in to view the full illustrated article in PDF format)
| The British Astronomical Association supports amateur astronomers around the UK and the rest of the world. Find out more about the BAA or join us. |