2019 August 11
An introduction to variable star observing
At the turn of the 19th century there were very few variable stars known, certainly less than a few dozen. Nowadays, the “Bible” for all types of variable star (the General Catalogue of Variable Stars) lists nearly 90,000! Even simple observation of these stars can yield information about their mass, radius, luminosity and evolution. And what’s more it can be done with the simplest of equipment.
We usually observe variable stars by watching (measuring or estimating) their variations over time, be it hours, days, weeks, months or even years. These variations take the form of changes in brightness (magnitude) and are viewed pictorially by means of graphs termed light curves (Figures 1 and 2) where the magnitude (y axis) is plotted against time on the x axis.
Light curves:-
 Omicron Ceti (Mira)_.jpg)
Figure 1. BAAVSS lightcurve of the Long Period Variable (LPV) Omicron Ceti (Mira).
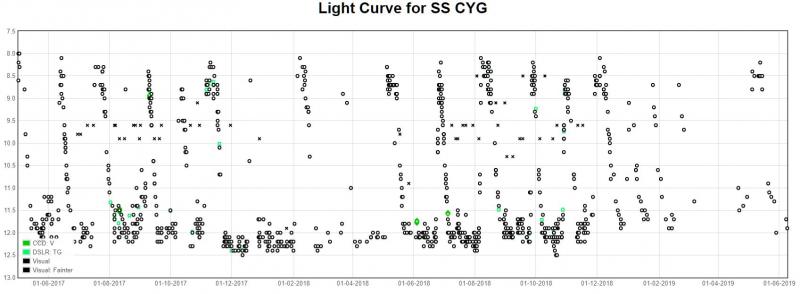
Figure 2. BAAVSS lightcurve of the frequently-outbursting cataclysmic variable (CV) SS Cygni.
Instrumentation
The simplest instrument to use to make observations is the naked eye, although this is rather limiting as there are not too many variables available to you. However, the most basic pair of binoculars will open up hundreds of variables for you to observe and of course the larger the binoculars the more stars you can follow. The same applies to telescopes, of course.
Binoculars of 10 X 50 or 7 X 50 are good as are 8X40s which are also lighter. Anything giving more than 10X magnification is difficult to hold and therefore should be mounted. Even a simple temporary support will suffice. If you’re not sure if you really are going to take up binocular observing don’t spend more than about £50-£100 unless you know you might also want them for, say, bird watching.
You can also use any telescope. A wide field of view is good so that you can observe the variable and the comparison star(s) in the same field of view. A Dobsonian or similarly mounted telescope which can be made ready to observe in but a minute or two will also allow you to make use of those short gaps in the cloud! David Arditti has written excellent articles in the Journal on which telescope/binocular a beginner might wish to purchase (J. Brit. Astron. Assoc., 128(5) 261 (2018); J. Brit. Astron. Assoc., 128(6) 325 (2018); J. Brit. Astron. Assoc., 129(1) 11 (2018)).
For the more advanced observer a telescope with a CCD or DSLR camera is particularly useful.
The VSS Observing Programmes
The VS Section splits its observational programmes into a number of different categories which include the CV & Eruptive, Pulsating, Eclipsing, Supernova and CCD Programme The latter is designed to help those with CCDs (or DSLRs) to obtain scientifically useful results. Further details of each of these programmes can be found on the VSS website.
Below are examples of the Pulsating Star Programme (Table 1). where we see that the name of the variable star comes first followed by its position in hours and minutes of Right Ascension and degrees and minutes of Declination given for the epoch 2000. Don’t worry if you’re not familiar with these terms at first as they are not necessary when you first set out as you have charts to help you find your chosen variable (see below). Next comes the star’s type (you can learn about these later); its range of magnitude; its period (if one is known) and finally the chart you’ll need to help find and estimate its brightness.
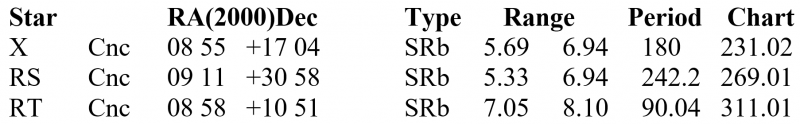
Table 1. The Pulsating Star Programme.
The Cataclysmic and Eruptive Star Programme, Table 2, is similarly set out except you have an extra column, which is for an indication as to whether or not you should alert someone (the Director, for example) if the star is seen in outburst.
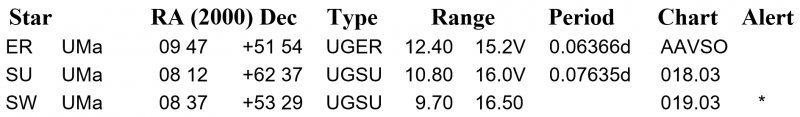
Table 2. The Cataclysmic and Eruptive Star Programme.
Charts
The VSS publishes charts for most of the stars on its programmes. Each chart shows the position of the variable against the background sky pattern, and the positions and magnitudes of a series of standard comparison stars (the ‘sequence’) against which you make your magnitude estimates. Computer generated star charts are excellent for producing finder charts for those variable stars which are difficult to locate, although the official chart should always be used for making estimates, so that your results can be compared or combined with those of other observers.
The VSS Mentoring Scheme
This programme was set up to help those new to VS Observing – both visual and CCD. Communication is via email, telephone, sharing observing sessions or even by snail mail. Further information is available on the web site or from the Director.
CCD Observing
The introduction of CCDs to the amateur market has revolutionised the way many observers make their observations. The VSS has therefore introduced a CCD programme of variable stars suitable for different levels of interest, equipment and observer skills. Again, further details can be found on the web site.
What are Variable Stars?
There are three main types of variable star as observed by members of the Section: Pulsating, Eclipsing and Eruptive.
Pulsating Stars (Mira, SRs etc)
The variations are caused by the star physically pulsating, like a balloon blowing up and down, but only the outer layers are involved. Periods range from hours to years, depending on the type. The range in brightness is from about 0.5 magnitudes to over 10.
Eclipsing Binary Stars (EBs)
The variations are caused by two stars in our line of sight that physically revolve around each other. Periods range from hours to many years. Some may be seen to undergo an entire eclipse in a single night.
Eruptive Stars (CVs, Novae and Supernovae)
These show variations from gentle sun-like ones to gigantic explosions we call supernovae. Many CVs (‘cataclysmic variables’) are actually binary stars in which the eruptions are due to an exchange of material from one star to the other, often via an “accretion disc”. There are many subtypes of CVs, including UGSS, UGSU, ZAND, etc. They form one of the most interesting areas of observing.
Nomenclature
Variable star nomenclature is somewhat confusing. By the beginning of the 17th century Bayer had designated the brightest stars in each constellation using Greek letters, e.g. alpha Cas and lower case roman letters, and the first part of the alphabet had also been used for other purposes. When F. W. Argelander (1799−1875) instigated a formal naming convention for variables he didn’t think that there would ever be any need to name more than nine variables in each constellation! He started with the letter R, for the first variable discovered in a constellation, e.g. R Andromedae, the next S And, and so on, all the way to Z And. However, this proved insufficient and the sequence was continued by using RR And, RS And …. down to ZZ. When even more letters were required, he went back to the beginning of the alphabet using AA to AZ, BB to BZ, through to QZ. Only then did sense prevail and so the 335th variable discovered in any one constellation was labelled V335 plus the constellation name.
Assignment of these numbers to newly discovered variables is the responsibility of the Sternberg Astronomical Institute in Moscow, which waits until the variability and its type has been confirmed before issuing a number. Meanwhile the big professional surveys, which now discover many thousands of new variables every year, issue their own labels for their discoveries, hence the ‘telephone number’ designations e.g. SDSS J093249.57+472523.0, which appear so often in the titles of variable star observing papers in the Journal.
How to find and estimate the brightness of a variable star
Finding the Variable – Z Ursae Majoris (Z UMa)
As stated previously, modern planetarium programmes can be most useful in helping you find your way around the night sky and to even print out charts of specific areas of interested. BAA VSS charts to help you locate the variable against the background stars can be downloaded from the Internet or requested from the Chart Secretary (Figure 3).
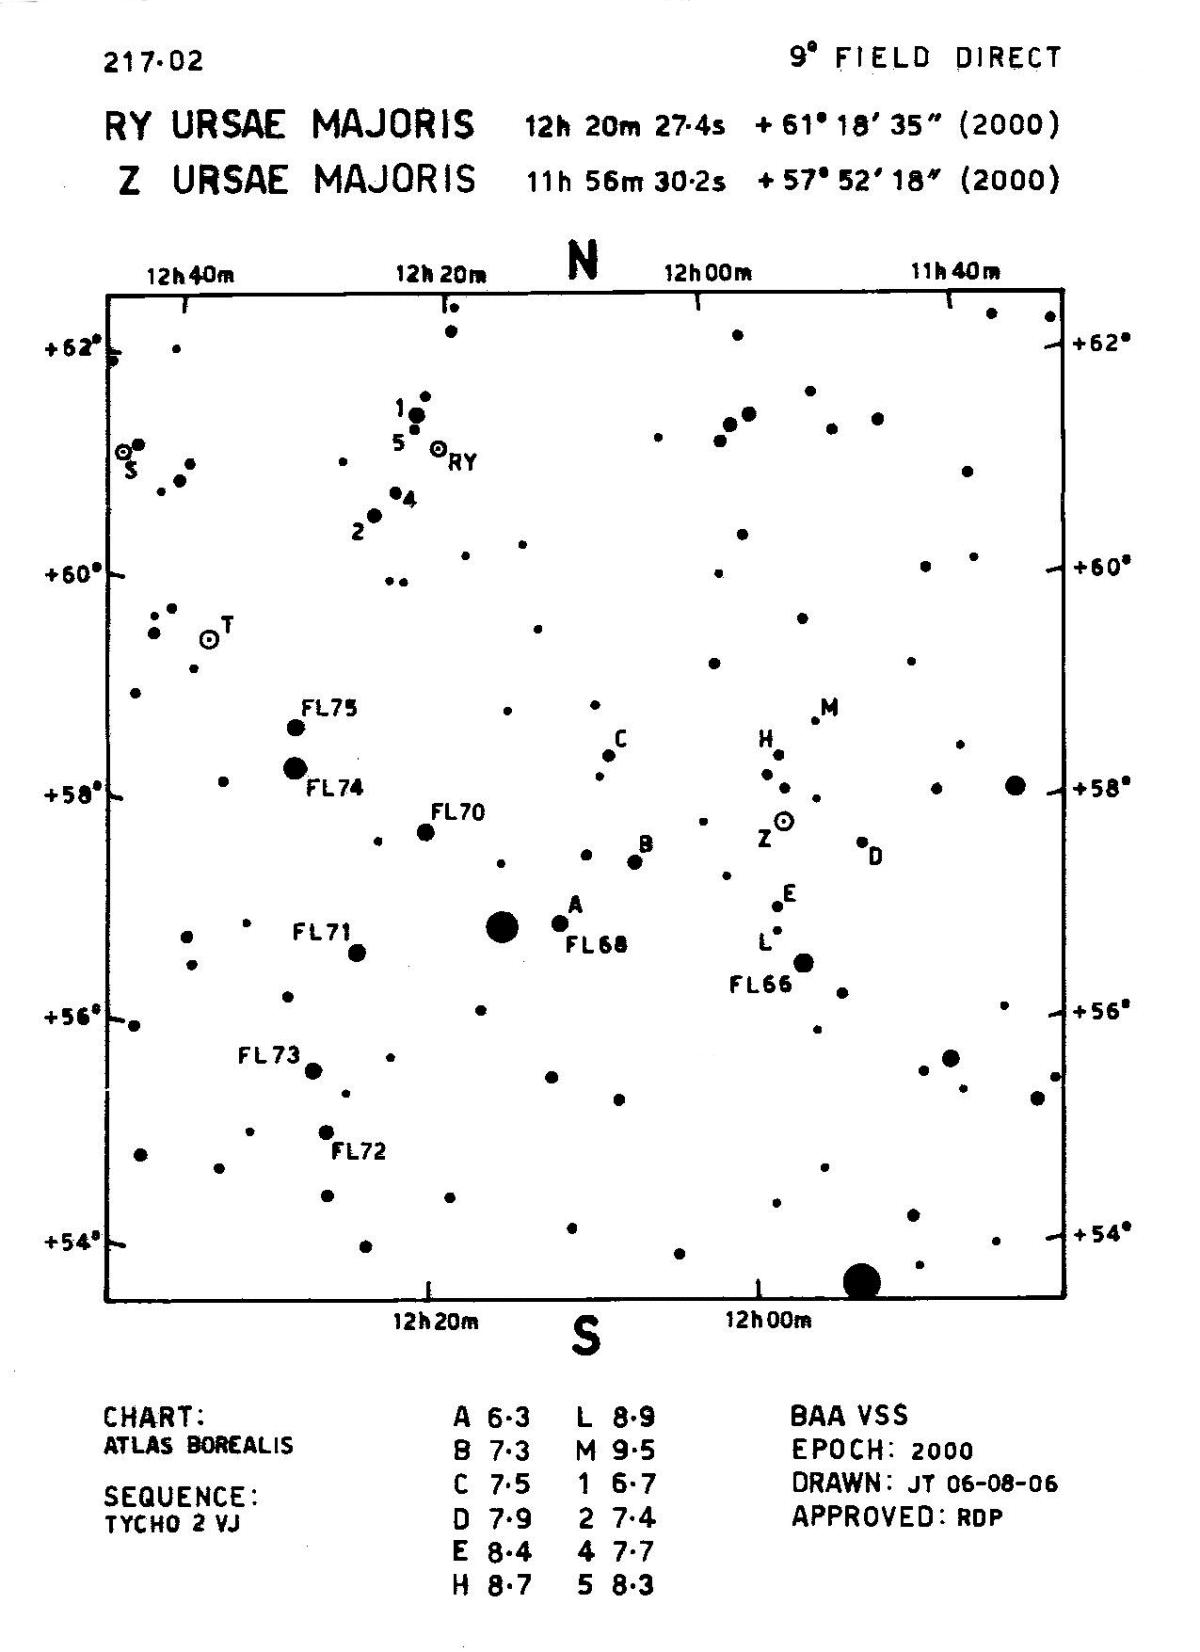
Figure 3. The BAA VSS Chart for Z UMa.
Estimating the magnitude−the fractional method
How do we estimate the brightness of a variable star? There are two methods used within the variable star community, the fractional and Pogson step methods.
With this method you compare the variable with one star slightly brighter and one slightly fainter than the variable. These ‘comparison stars’ are stars of known and consistent brightness, shown on the chart (Figure 3) with lettered labels. Labelling the variable “V” and the comparisons “C” and “D” and assigning the magnitudes of 7.5 and 7.9 to the comparisons, we can represent the estimate thus: C(1)V(1)D, if you make the variable half way in brightness between C and D. However, if you make the variable nearer to C than D in brightness you could write C(1)V(3)D, indicating that you saw it one “step” fainter than C but three “steps” brighter than D.
Now we need to convert these records into a magnitude. Take the first estimate C(1)V(1)D, this is easy to compute as it lies exactly half way in brightness between the two comparison stars which equals 7.7.
In the second estimate of C(1)V(3)D the “steps” between C and D are 4 (1+3) and the difference between D and C is 7.9 – 7.5 = 0.4. Therefore, one step is equal to 0.1 magnitudes so V is estimated to be 7.5+0.1=7.6. Remember, it is fainter than the brightest comparison and so we have to add 0.1 to 7.5. We could have worked this out by subtracting three quarters of the difference between C and D (0.4*3/4 = 0.3) from the brightness of D (7.9 – 0.3) = 7.6, and we have the same answer!
The Pogson step method
This is a different method of estimation in which you try to judge the brightness difference between the variable and just one comparison star in steps of tenths of a magnitude. It is an essential technique for occasions when the variable star has become fainter than the faintest star that is on the sequence that you can see, for example, or is even not visible at all! So if the variable were considered to be two tenths of a magnitude fainter than a comparison star C, for example, but you couldn’t see D, then we would write this down as C-2. If the variable was one tenth of a magnitude fainter than D, we would write D-1. Remember in this case when calculating the actual magnitude, with an estimate of C−2, if C is mag 7.5 you must add two-tenths of a magnitude to C to obtain your result (7.7) because the star is fainter than C.
Reporting your observations
For your observations to be of real value they should be sent to the VSS so that they can be added to the database. This now contains over 3,000,000 observations of more than 2000 variable stars from more than 900 observers, dating from before the foundation of the Section in 1890.
Although the Section provides suitable report forms (Figure 4) which can be requested from the Director or simply downloaded here, you can also use an Excel spreadsheet and this too is available via the Internet. However, it is far better nowadays to enter your own observations into the database which can be done immediately after your observing session should you wish. Information on how to do this is also given on the web page.
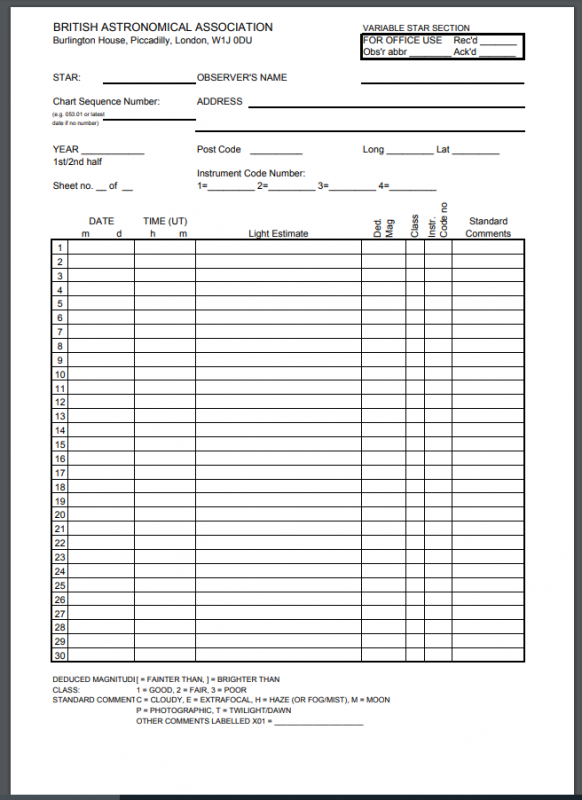
Figure 4. A paper report form.
Once you have made a number of observations it can be fun to plot them on graph paper, or better, use a spreadsheet – see Figure 5.

Figure 5. A personal light curve for Z UMa.
Common sources of error
Bias – Over observing
Do not over observe a variable star. For example, Mira stars only change slowly in brightness, perhaps only one magnitude in a couple of weeks at most. Over observing can mean you might be subconsciously expecting a star to brighten or fade when in fact it has stopped brightening of fading.
The recommended frequency of observing depends on the type of variable:
– LPVs (Long period variables, or Miras) roughly every 7 days
– SRs (Semi-regulars) every 10 days
– CVs (Cataclysmics) every night
For eclipsing binary stars, the recommended minimum interval can be as little as 30, 20 or even 10 minutes during eclipse, depending upon the rapidity of the fade and rise.
Purkinje Effect
If you have two stars of different colour, one red and one green, but equal in brightness and you increase both by the same amount, the red appears brighter than the other (and conversely if they are decreased in brightness). In practical terms, a red star will be overestimated in brightness in a bright sky – twilight or moonlight.
Misidentification
Make sure you’ve identified the field correctly! This is one of the most common sources of error.
Hints and Tips
1. When writing down the estimate the brightest star is ALWAYS written first.
2. It is quite legitimate to write =A (or whatever) if you think the variable is
equal in brightness to a comparison.
3. If the variable is faint use a higher power and/or averted vision.
4. A drive can be useful if you use a higher power to observe faint stars a lot.
5. Frequency of observing:-
LPV (Mira) every 7 days
SR every 10 days
RV every 5 days
CV’s every day
EBs (see below)
For eclipsing binary stars the recommended minimum interval can be as little as 30, 20 or even 10 minutes during eclipse, depending upon the rapidity of the fade and rise.
6. Deduced Mag. This is recorded to the nearest 0.1 mag and is rounded down i.e. 9.45 becomes 9.5 but 9.44 becomes 9.4.
7. Class refers to the quality of the observation and not the seeing conditions, although they can affect it:-
1 = Excellent
2 = OK
3 = Poor
Record class 2 if the variable or one of the comparisons is difficult to see; if you are tired or the moon is close by, etc. Record class 3 only if fleetingly glimpsed or hampered by much cloud etc!
8. Know the size of your field of view (telescope and binoculars). Charts are produced for different fields of view depending on the expected brightness of the variable.
9. Don’t use comparisons near the edge of the field of view but bring them to the centre alternately.
10. Note that LPV’s (Mira’s) at maximum and SR’s tend to be red and take care to minimise the Purkinje effect.
11. Use a faint red light.
12. Wait until you are fully dark adapted before making an observation (this can vary from person to person and be a little as a couple of minutes to half-an-hour or more).
13. Be comfortable and WARM.
14. Note that early morning observations are particularly useful.
Establishing your own Programme
As a first step to compiling your own programme establish the following: What is your possible magnitude range as dictated by your equipment? What type of stars are you interested in, or do you want to sample many types? How often do you want to observe? What area of the sky is available to you? Do you have restricted views in any direction? What time do you prefer to observe? Try to select stars that are not already grossly over-observed. If you have a large telescope then concentrate on observing stars that are relatively faint.
Once you have all this information, consult the list of stars on each of the VS programmes and observe your chosen star(s) for a couple of months (depending on type). Compare your results with your mentor, or other VSS members.
A list of suitable binocular and telescopic stars that can be observed in the Autumn can be
found in Tables 3 and 4.
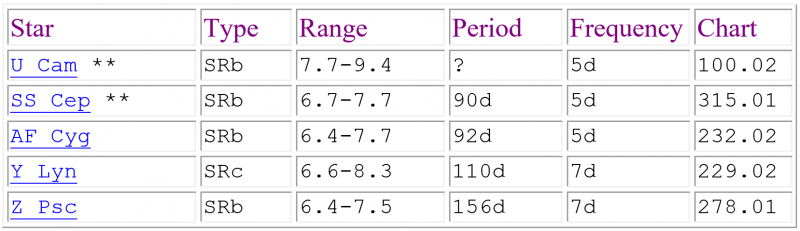
Table 3. Suggested list of suitable binocular stars.
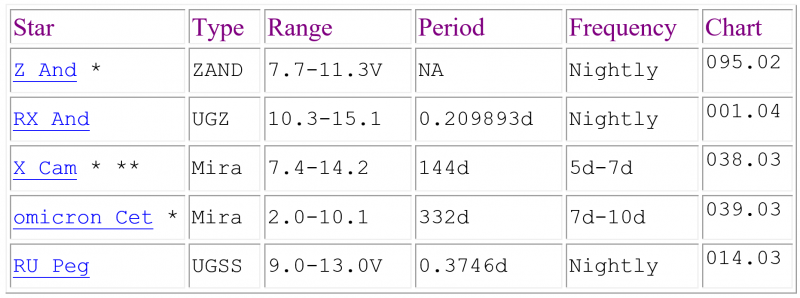
Table 4. Suggested list of suitable telescopic stars.
SUMMARY
Conclusion − why observe variable stars?
Variable stars can tell us much about stellar evolution and ultimately, the fate of our own Sun. Professional astronomers need amateur observations as there are just too many variable stars for them to follow. Their telescopes are often too large, and observing time on them is scarce. This is one of the few areas where an amateur can make a real contribution to science.
Why observe variable stars? It’s simple and fascinating to watch stars that are billions of miles away changing in brightness, and to learn about these systems from data that is obtained using your own eyes. Not only that, but your observations can be scientifically useful too, be they made as part of an observing campaign or just to extend the historical lightcurve.
https://britastro.org/wp-content/uploads/2019/08/picreportform.PNG
| The British Astronomical Association supports amateur astronomers around the UK and the rest of the world. Find out more about the BAA or join us. |