Jupiter in 2020, Report no.6: NTBs jetstream outbreak
Jupiter in 2020, Report no.6: The NTBs jetstream outbreak
One of Jupiter’s most energetic and fast-moving phenomena erupted unexpectedly on August 18, and is becoming ever more spectacular. It consists of a brilliant white plume in the NTBs jetstream (at 23ºN), which is producing an elaborate growing wake behind it. Observers have achieved excellent coverage of the first ten days, as summarised below, and compilations of images from the first week are posted herewith.
It is now very desirable to get hi-res images of it on every rotation of the planet. For the best chance of doing this, we ask observers please to take images of the outbreak on every possible rotation over the next week (Aug.30 to Sep.6). Although these outbreaks follow a fairly standard timecourse, this time we have the opportunity to record its dynamics in greater detail than ever before, while is is still vigorously expanding. Study of past outbreaks by Agustin Sanchez-Lavega and colleagues [ref.1] suggested that the wake would contain anticyclonic vortices, and a map animation of hi-res images now could investigate this. We would like to see images in visible colour, and also in other wavebands. Dr Sanchez-Lavega makes the following requests:
“(1) Take frames in IR filters with short exposures to bring out details (structure) in the head of the plume (not saturating it); (2) The same for images obtained in the methane filter (890 nm); (3) Take images in UV, if possible with filters in the wavelength range (360-400 nm)….. It is interesting to characterize the time scale of the brightness changes of the plume in UV and in 890 nm.”
Also, please continue regular imaging of all longitudes, because these outbreaks often start at multiple locations so another plume could appear at any time.
The plume is moving at DL1 = -4.8 deg/day (DL3 = -12.2 deg/day), according to the chart by Shinji Mizumoto [ref.4]. (This value fits almost all measurements after Aug.18, although early estimates were slightly slower, suggesting genuinely slower drift on the first day and then expansion of the incipient tail on the next few days.) It passed the GRS on August 27, and should pass it again around Sep.25. We expect that the turbulent tail of the plume will continue to expand over the coming weeks and months, eventually resulting in a revival of the NTB with an orange southern component.
This outbreak was expected next year but it has started a year early! Previous outbreaks in this series occurred in 2007, 2012, and 2016, though only the first was observed thoroughly, as the 2012 and 2016 events took place largely during solar conjunction. These were all covered in our regular reports, plus final accounts of 2007 in [ref.2], and of 2012 with a general discussion in [ref.3], and of 2016 from a professional angle in [ref.1].
The course of the outbreak so far has been as follows (see figures below):
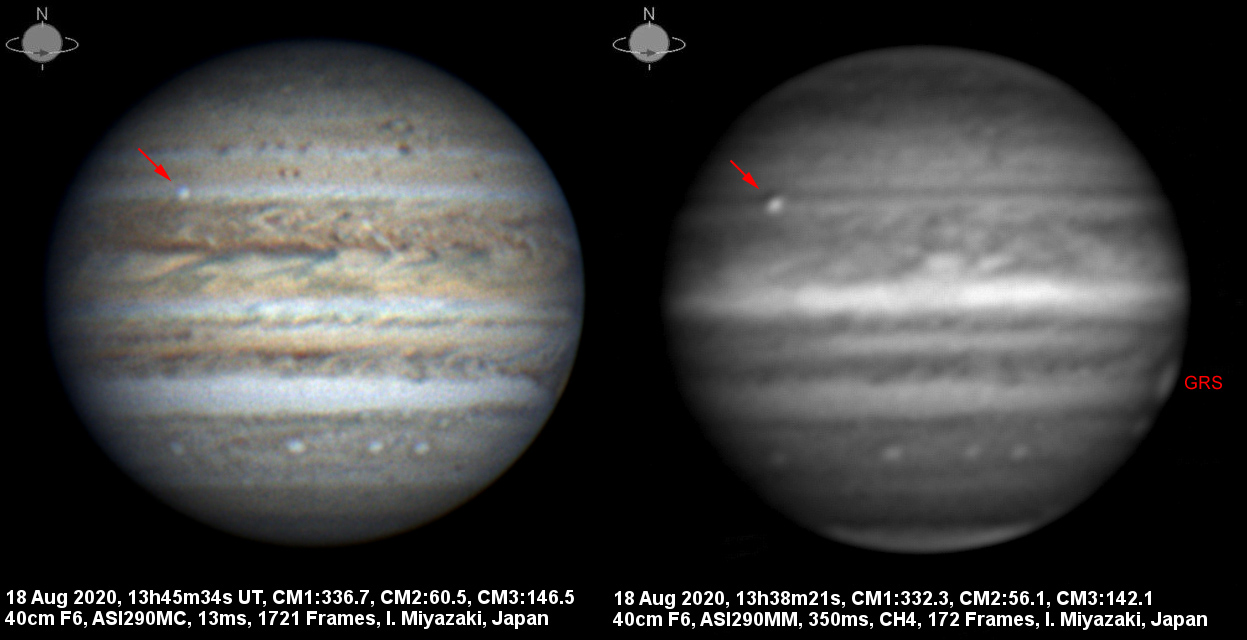
On August 18, Isao Miyazaki reported that he had just imaged a new, extremely bright spot which appeared to be the start of a NTBs jetstream outbreak. It had actually been recorded in images on the previous rotation, on Aug.18 at 03:47 UT, by Damian Peach with ChileScope and by Martin Ratcliffe, thought it was much fainter then. It was undetectable on Aug.17.
This white spot is very bright at all wavelengths from UV to IR including the methane band, indicating that it is a plume rising high above the main cloud deck. On Aug.18 it already had a trace of a narrow bluish f. border. On Aug.19.4, the plume appeared closely double, and it was wider on Aug.19.8. This appearance was reminiscent of Clyde’s spot in the STB at a similar time after its eruption. But in this case, the eruption was on a grander scale, and the plume persists with full vigour, while the doubling was the beginning of emergence of a long bright tail on the f. side. On Aug.20.6, it had a bright tail apparently intruding into the (recently expanded) NEBn, but this was a transient interaction with a pre-existing structure in the NEBn. As the plume moved on, its tail continued to grow and became distinct from the plume head.
Also from Aug.20.6 onwards, a blue-grey patch developed on the f. side of the plume head, N of the bright tail; and from Aug.22 onwards these began developing into an increasingly complex wake. This was especially striking on Aug.25 when the appearance suggested two anticyclonic cells (vortices?) in the wake, with their S edges formed by waves in the tail along the NEBn. But this regular appearance has not persisted.
Incidentally, the methane images still show a very dark patch on the NEB at L3 ~ 245. But there is not a wave-like series of such methane-dark patches, as there was during the previous NEB expansion events in 2015-2017.
References:
1. Sanchez-Lavega A et al.(2017). ‘A planetary-scale disturbance in the most intense Jovian atmospheric jet from JunoCam and ground-based observations.’ Geophysical Research Letters 44, 4679–4686. https://agupubs.onlinelibrary.wiley.com/doi/epdf/10.1002/2017GL073421 [see Figure 3]
2. Rogers J & Mettig H-J (2008), ‘Jupiter in 2007: Final Numerical Report.’ http://www.britastro.org/jupiter/2007report20.htm
3. Rogers JH & Adamoli G (2019) JBAA 129 (no.3), 158-169. ‘Jupiter’s North Equatorial Belt and Jet: III. The ‘great northern upheaval’ in 2012.’ https://britastro.org/node/15629. Also at: http://arxiv.org/abs/1809.09736
4. Mizumoto S (2020), ALPO-Japan, ‘Jupiter Cylindrical_Maps & Animation’: http://alpo-j.sakura.ne.jp/Latest/j_Cylindrical_Maps/j_Cylindrical_Maps.htm
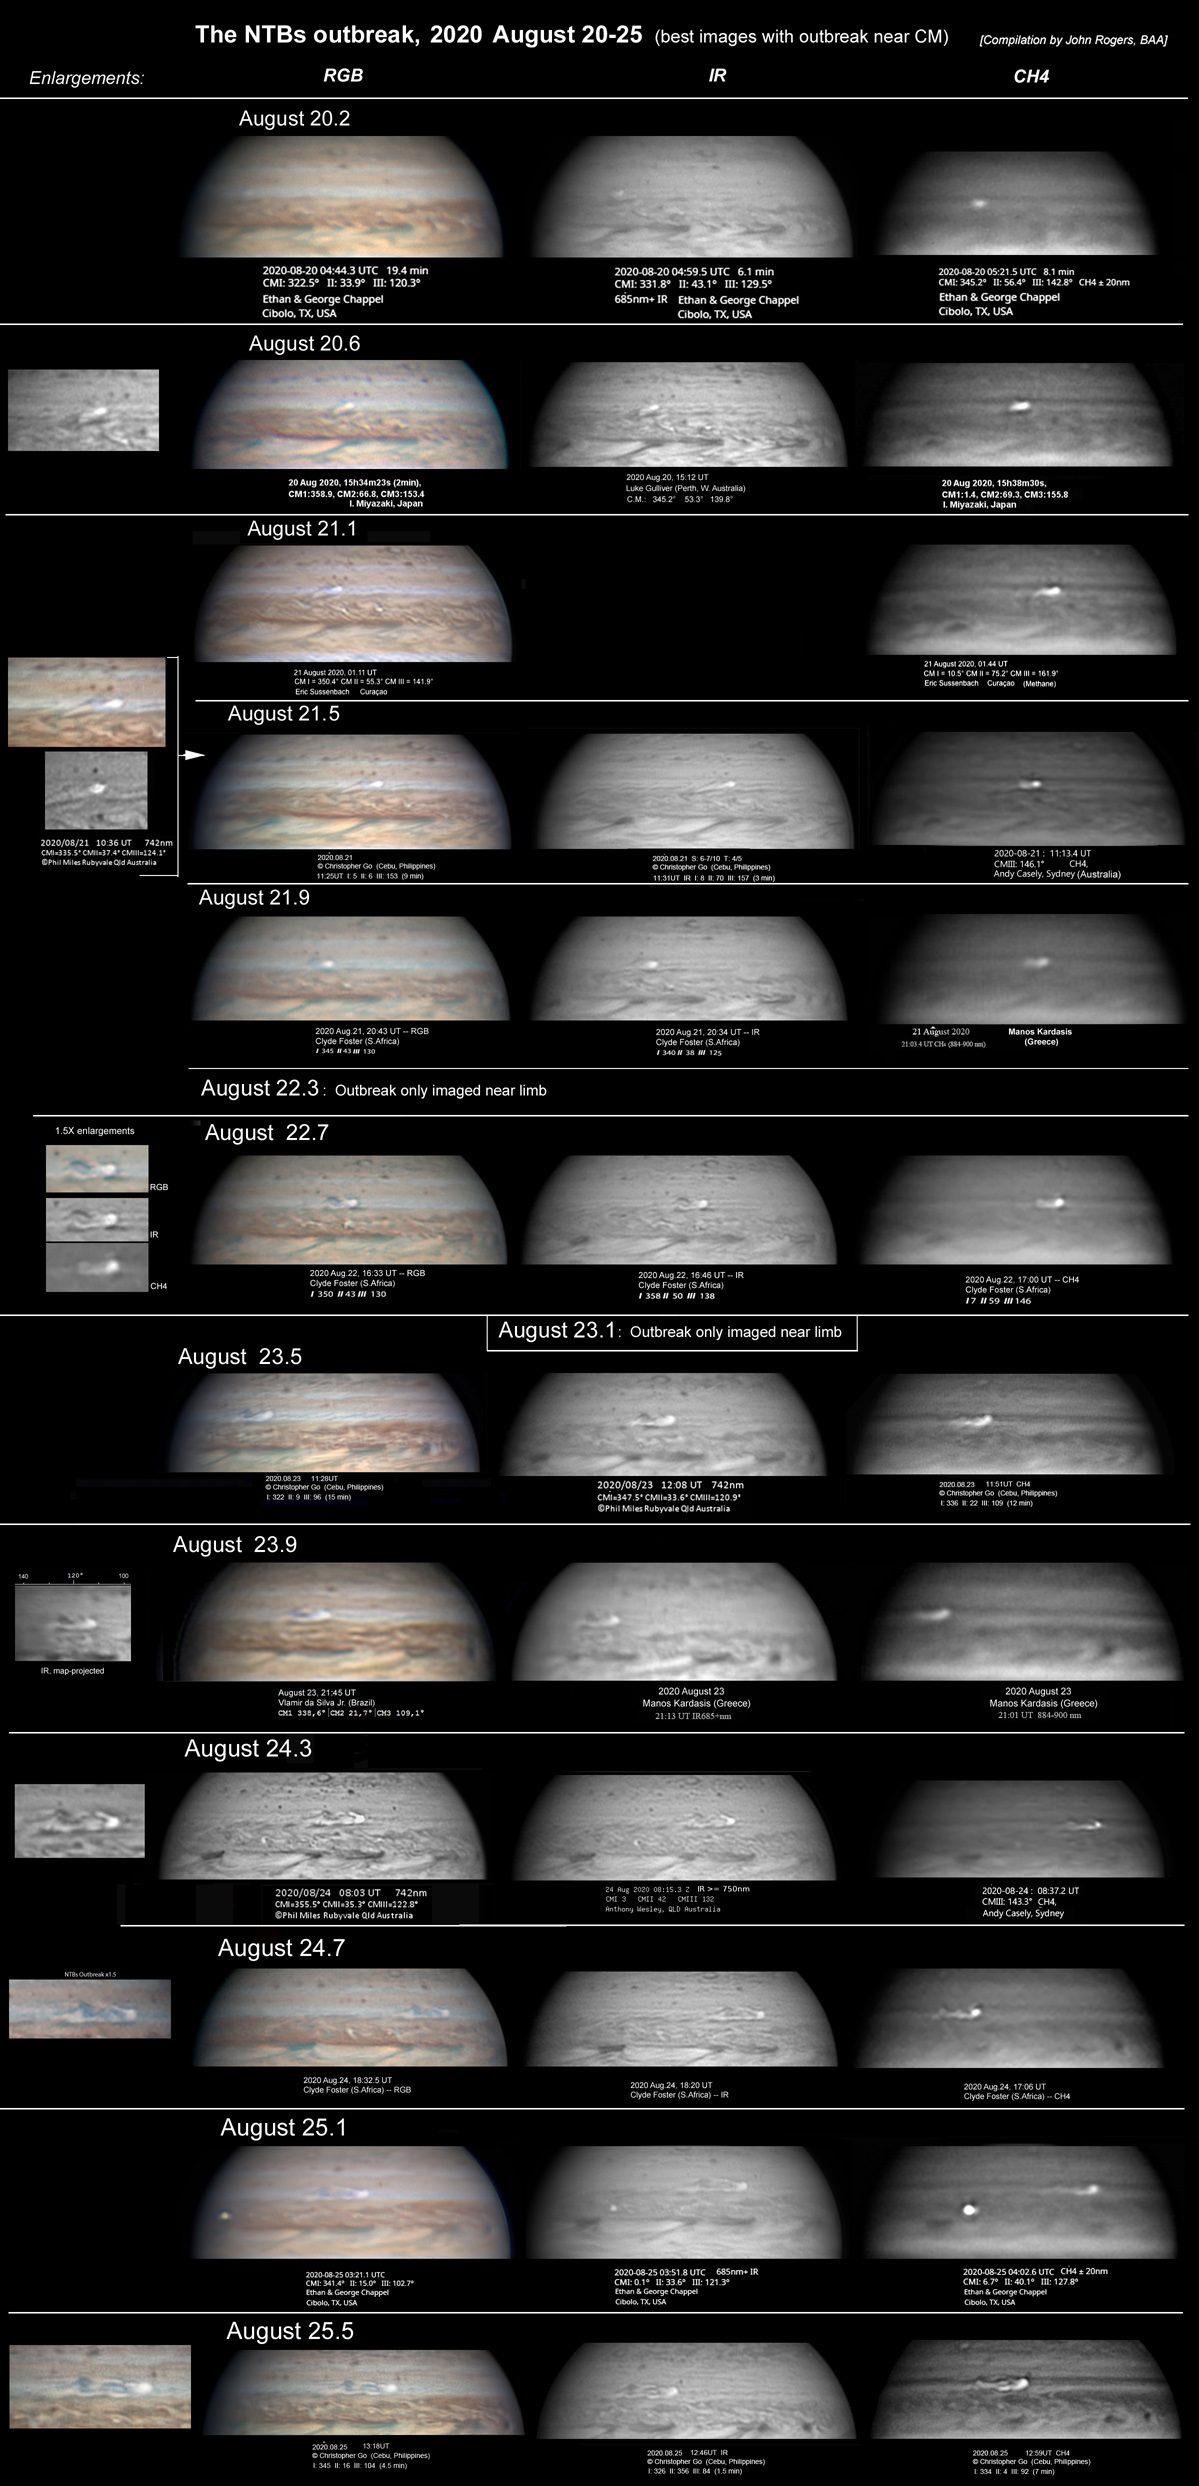
Figure 1 (below) shows Isao Miyazaki’s discovery images, and Figure 2 (below) shows RGB, IR, and CH4 images from each rotation where hires images were available.
In the ZIP file are compilations of images from August 17 to 25, using images of the outbreak from most or all observers on August 17-21, then a selection of the best ones on August 22-25. The outbreak was imaged on every rotation over this period but sometimes only at low resolution or near the limb.
Shinji Mizumoto has produced maps of the outbreak from these images, which are posted on the ALPO-Japan web site [ref.4]. Animations of these (in IR and in CH4) are posted below.
Sets of images from August 17 to 25 (ZIP file): Report-no-6_Images-of-NTBO.zip
Animations of Shinji Mizumoto’s maps, in IR (L) and in CH4 (R):
Figures 1 & 2 (reduced scale):
| The British Astronomical Association supports amateur astronomers around the UK and the rest of the world. Find out more about the BAA or join us. |