Jupiter in 2003/04: Report no.5 (2004 May 6): The NEB
More Jupiter bulletins, 2004 May 6:
Colourful phenomena in Jupiter’s NEB
The recent upsurge in activity in the NEB, largely from an apparent source region around L2 ~ 340, has resulted in several striking phenomena reported by observers, viz:
1) More changes in NEBs dark projections.
2) Colour fringing of the NEBs bright bays.
3) A ‘greenish’ spot on NEBn!
This short report describes these phenomena, illustrates them with sets of images from various observers, and shows how they are related to the activity in the NEB.
(As always, features on NEBn remain near a certain L2 longitude, while features on NEBs remain near a certain L1 longitude, thus overtaking the NEBn features at a speed of 7.7 deg/day. Rifts within the NEB move at intermediate speeds.)
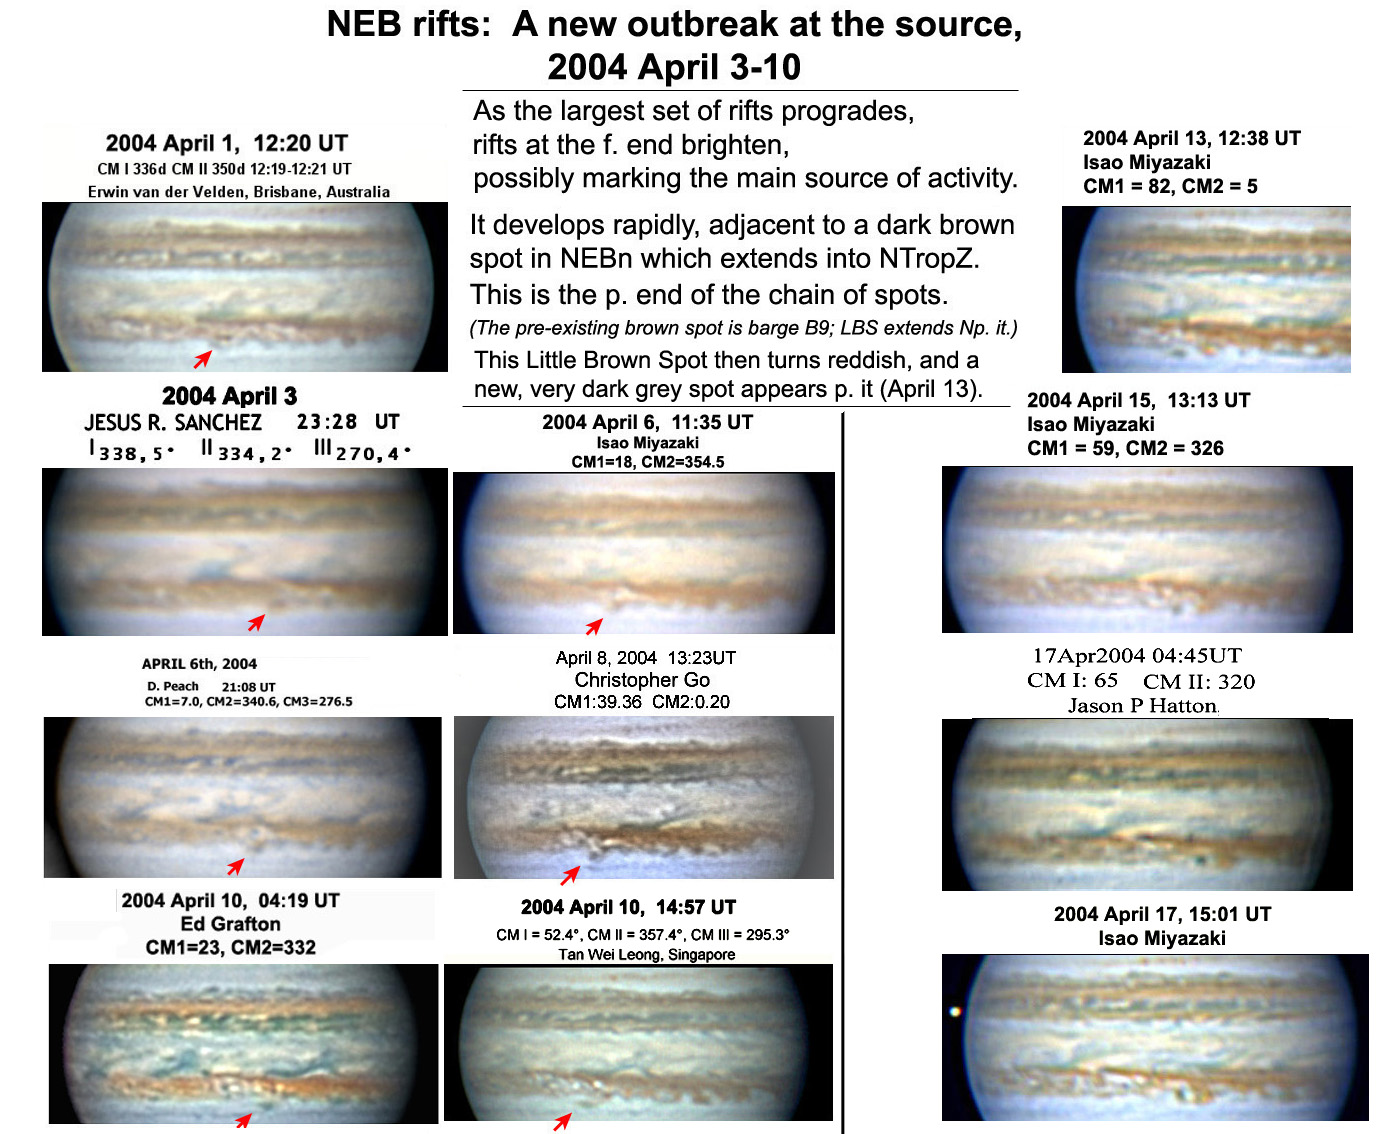
First, a summary of my previous bulletin on the appearance of the so-called source region:
In the first week of April, a bright new rift appeared in the NEB around L2 ~ 340, and a little dark spot appeared in NTropZ (at L2 = 344). The new rift was at the f. end (and presumed source region) of the main rifted region, and the little dark spot was on the Np. edge of the small barge B9, which is the only one of the barges to have survived from the previous apparition. This little dark spot rapidly became reddish-brown; it is a typical little brown spot (LBS) of this latitude. On April 13, another dark spot appeared at L2 = 336 in NTropZ, but this one is very dark grey. Meanwhile the chain of dark spots on NEBn f. this longitude, noted in previous e-mails, has become more extensive, evolving into full northwards expansion of the NEB from L2 ~ 340 – 95. The story continues:
1) More changes in the NEBs dark projections.
As explained in previous interim reports, the dark bluish projections on NEBs are often disrupted or enlarged or intensified as they pass a rifted region of the NEB. The attached set of images shows this happening to the projections I have named ‘m’ and ‘a’ as they passed the source region, where a bright set of rifts had developed.
Proj. m became disturbed and complex as it passed the rift at the source region, in early April. It then became longer on its f. side, and the p. half faded while the f. half intensified (April 26). This intensified f. half was noticed by Frank Melillo and others on April 29 as a visually black spot like a satellite shadow. Thus proj. m had shifted ~10 deg. f. its previous track.
Proj. a was likewise disturbed as it passed the rifts at the source region, and shifted ~10 deg. f. its previous track (April 13).
2) Colour fringing of the NEBs bright bays.
A striking feature of many images from April 13 onwards is red/yellow colour fringing on the EZn edge, in the bright bays flanking projs. m and a and others further f. This is most obvious in Miyazaki’s images, which appear to have enhanced colour saturation, but it is also visible in images by other observers. (In the attached image compilation, I have adjusted or enhanced the colour of images by a few observers, to show the contrasts better.)
The colour fringing of the bright bays appears to be a spillover of haze from the adjacent NEB(S), where there is reddish colour induced by the rifts. Earlier in the apparition, we noticed that the NEB(S) was quite reddish on the Sf. side of the main rifted region. (It has also been methane-bright – this may represent a reddish high-altitude haze drifting Sf. from the rifts – but the multispectral images have yet to be analysed in detail.) I described in my book how reddish colour often follows NEB activity, and how such colour is not restricted by the standard belt/zone boundaries, on the global scale; these observations show a similar phenomenon on a local scale.
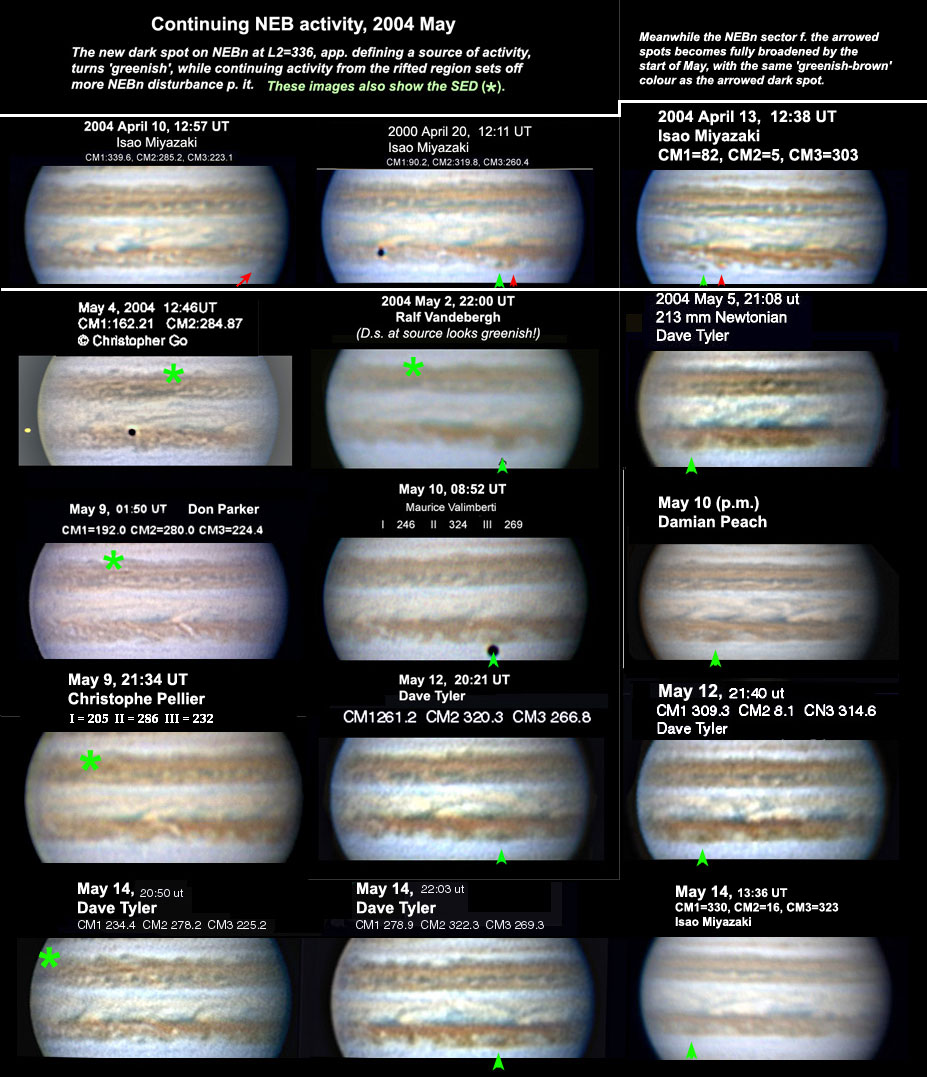
3) A ‘greenish’ spot on NEBn!
On May 2, Ralf Vandebergh (Netherlands) reported a greenish colour in a spot on NEBn – a very rare colour on Jupiter. This was in fact the very dark grey spot which appeared at L2 = 336 on April 13 in the NEB source region. By May 2 it was less intense and visual inspection of images, from 3 continents on 3 successive rotations, does indeed suggest a greenish colour (see attached image set). Of course such colour impressions on processed images are not absolute, any more than with the eye at the telescope. For what it is worth, sampling the colour on the images shows the spot is actually yellowish or brown in the processed images, looking greenish by contrast, but it is still remarkable. It looked even more greenish in Miyazaki’s image on April 27. More recent images indicate that much of the expanded NEB(N) f. this spot is adopting the same colour as the spot at the source.
&&&&&&&&&&&&&&&&&&&&&
Addendum, 2004 May 11:
4) Chart of speed vs. latitude across NEB.
The amateur images this apparition have revealed the winds within the NEB in almost as much detail as spacecraft movies!
This chart was made from the ‘JUPOS special’ charts prepared by H-JM, covering 2003 Dec. to 2004 April, in which he colour-coded spots in 1-degree latitude ranges. Bright spots were plotted from 5 to 7 deg.N and 9 to 19 deg.N; dark spots from 7 to 10 deg.N and 15 to 20 deg.N. Drifts of well-defined spots were measured by hand by JHR. These were spots with at least five measurements (usually >10), falling within no more than three one-degree bands of latitude. Lifetimes of spots ranged from 5 days to >30 days. The charts suggest that many other spots had similar drifts but were too short-lived or complicated to measure. Latitudes were assigned to the nearest half-degree by the colours of the points on the charts. Most drift rates are accurate to +/- 4 deg/month, but open squares indicates less precise drift rates (due to spots with shorter lifetimes or more variable drifts), accurate to perhaps +/- 10 deg/month. In the range 17-19 deg.N, these open squares are sequential values for Little Brown Spots which were oscillating with periods ~20 days. Symbols are circled for large spots which would have been tracked visually: white spot Z on NEBn (note that it is still moving faster than the average speed for its latitude), and the great dark projections on NEBs (not plotted as such, but the average speeds for two groups of them have been inserted at 7.3 deg.N which is the historical mean latitude for the NEBs). The larger scatter of drift rates at low latitudes may be because some spots are entrained by (or simulated by) the great NEBs projections and associated rifts and festoons; these spots have apparent speeds close to those of the projections, while some independent spots have faster speeds following the overall gradient.
John Rogers, 2004 May 11
__________________________________________________
| The British Astronomical Association supports amateur astronomers around the UK and the rest of the world. Find out more about the BAA or join us. |