2016-17, Report no.3: New mid-SEB outbreak
A white plume has erupted in a previously undisturbed sector of the SEB, and is likely to be the start of an impressive ‘mid-SEB outbreak’ of convective storms over the coming weeks – adding to the vigorous disturbances already under way in the NEB and NTB. The brilliant new white spot was discovered by Phil Miles in Australia on Dec.29, at L2 = 208, and is now expanding rapidly as its white clouds are sheared by the adjacent currents (Fig.1).
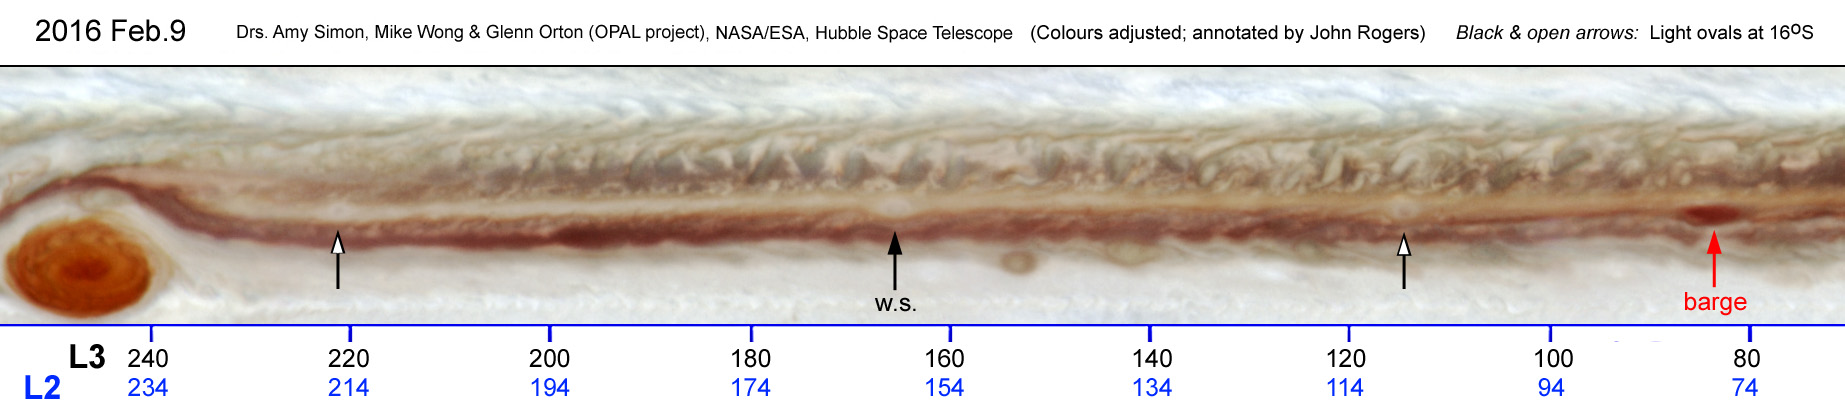
Dr. Agustin Sanchez-Lavega measured the outbreak latitude as 16.5 deg.S, and pointed out that it coincided with a pre-existing pale white spot, possibly a vortex. We had tracked two of these since last apparition, when they were at 16.1 to 16.3 deg.S (Fig.2). A Hubble map made 11 months ago (Fig.3) showed such spots to have oval shape suggesting that they were indeed cyclonic circulations. So the new outbreak apparently erupted within such a circulation, as did a similar mid-SEB outbreak in 1979 and the SEB Revival outbreaks of 2007 and 2010, although in all those cases the cyclonic circulation was dark reddish-brown. (The 1979 event was covered in detail by Voyagers 1 and 2; the new one will be visible to Juno at perijove-4.)
Such a ‘mid-SEB outbreak’ consists of convective storms appearing in a tightly confined region, similar to those of the perennial rifted region following the GRS (but in a different SEB sector), or to the very energetic ones that constitute a SEB Revival (but without prior SEB fading). This is the first mid-SEB outbreak since the SEB Revival of 2010-11. We can expect it to continue for many weeks, with more such bright spots appearing in succession at approx. the same L2 longitude. However, it is unusual for such an outbreak to appear not far preceding (east of) the GRS (which is at L2 = 261), so we cannot be sure if it will develop as usual.
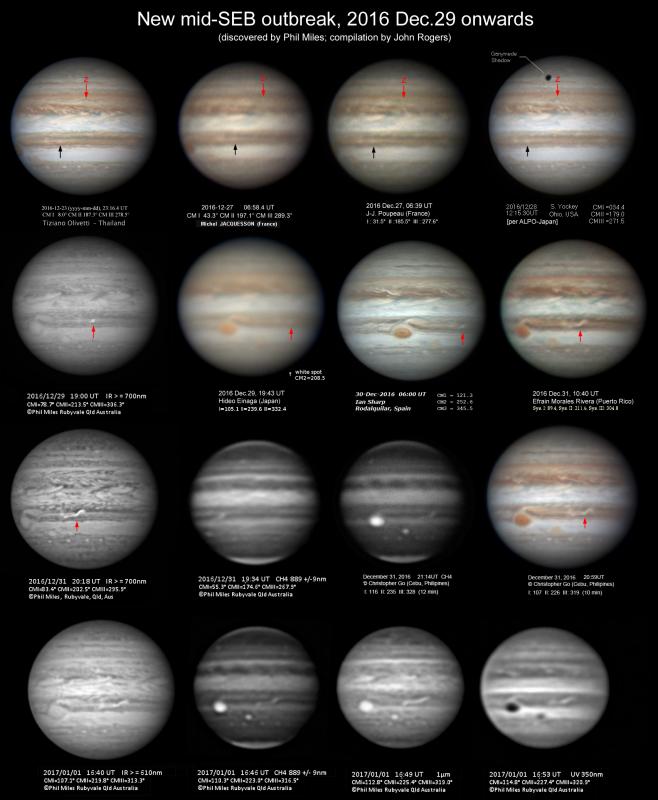
Figure 1. Images showing the new mid-SEB outbreak. Black arrow, light spot in which it was about to appear; red arrow, the new outbreak. North is up. (The images also show the dramatic disturbance and orange colour of the NTB/NTropZ/NEB; red arrows in the top row indicate what is probably White Spot Z, but it is buffetted by rapidly-changing dark streaks and is difficult to trace on later dates. It will probably reappear.) FULL SIZE FIGURE: Fig_SEBO_2016dec29f_N-up-labeld.jpg
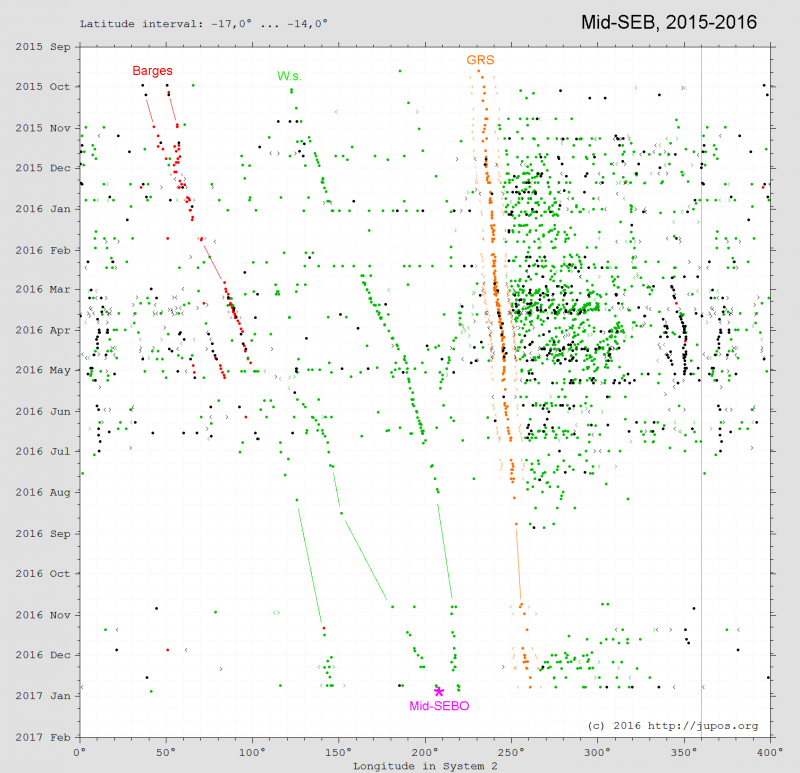
Figure 2. JUPOS chart of the mid-SEB (14-17 deg.S), plus the GRS. (Note that maps and images should have south up in order to align with JUPOS charts.)
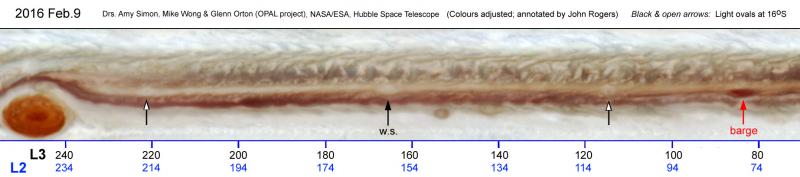
Figure 3. Part of a map from Hubble images on 2016 Feb.9, showing the SEB, with 3 oval light spots marked. Note their oval outlines. The one labelled ‘w.s.’ was tracked on the JUPOS chart (Fig.2), whereas the mid-SEB outbreak appeared in one which developed later in 2016. North is up. FULL SIZE FIGURE: Fig_HST-map_2016Feb9_SEB-crop.jpg
| The British Astronomical Association supports amateur astronomers around the UK and the rest of the world. Find out more about the BAA or join us. |