Jupiter in 2018, Report no.5
This is a quick update from opposition (May 9) through Juno’s perijove 13 (PJ13; May 24) to the latest JUPOS charts (June 15). Time has not permitted extensive assembly of images nor assessment of charts, but several other recorders have made compilations or animations that are referenced in the report.
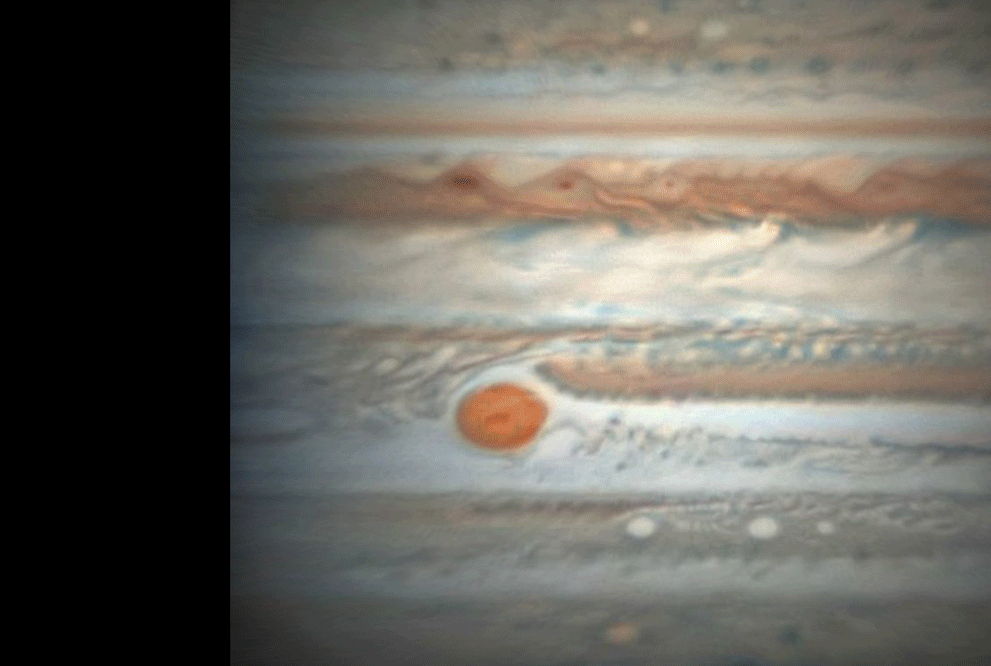
The most notable changes are: a new ochre coloration in the Equatorial Zone; passage of the S. Tropical Disturbance past the GRS; and two mergers of ovals, in the NNTZ and SSTZ.
A map from April 29-30 was posted in report no.3.
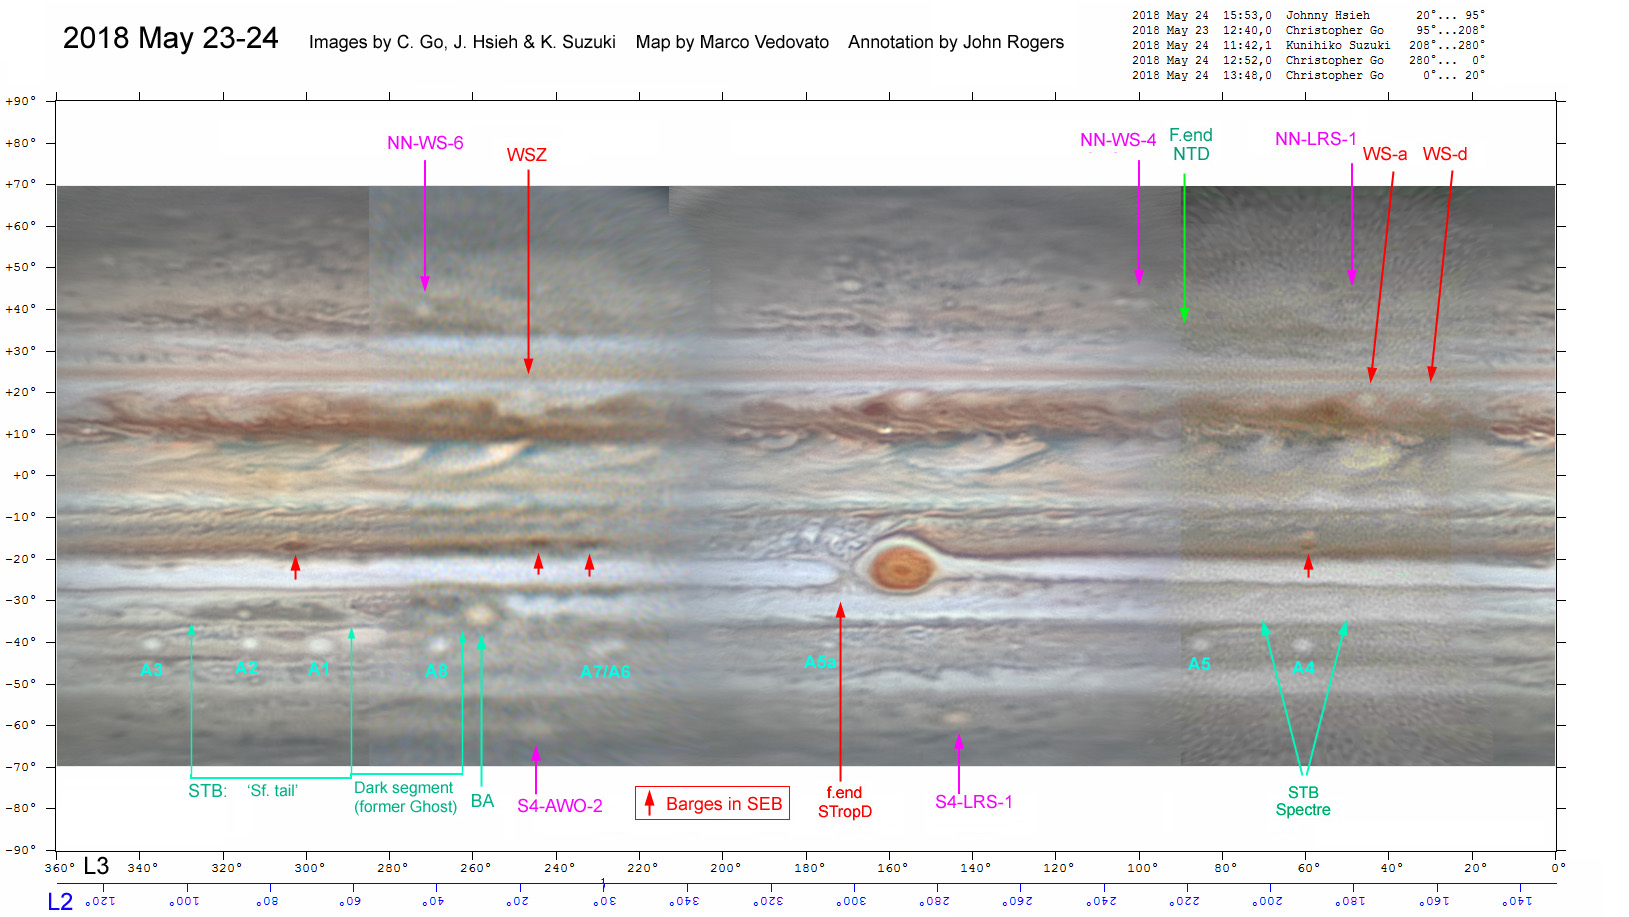
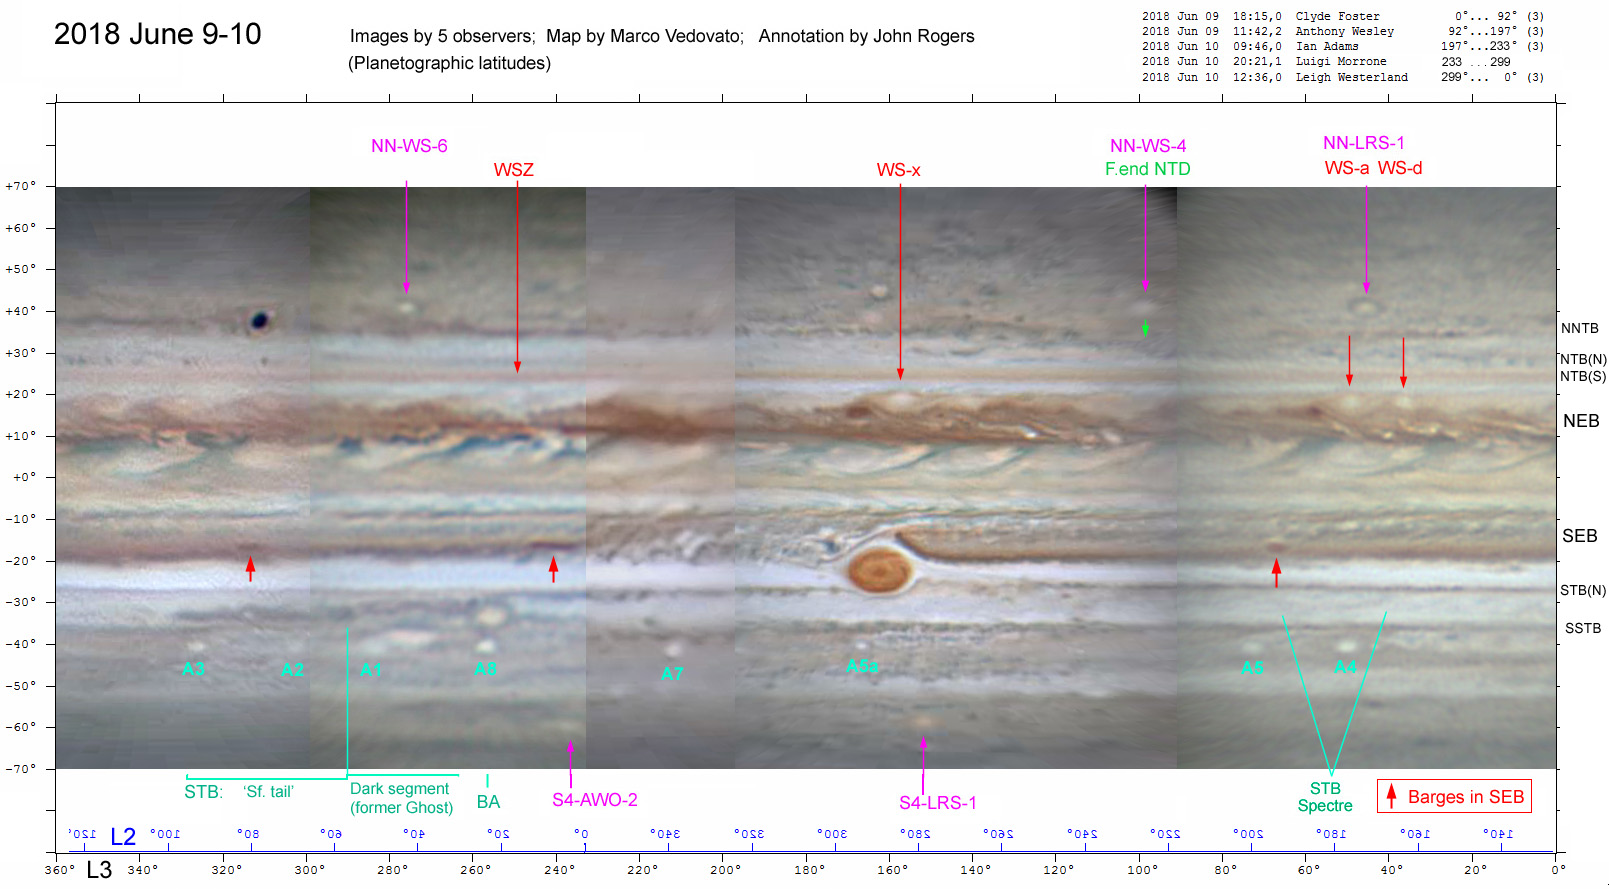
Figure 1 is a map from May 23-24, coinciding with PJ13. Figure 2 is the latest map, from June 9-10. Thanks to Marco Vedovato for all these.
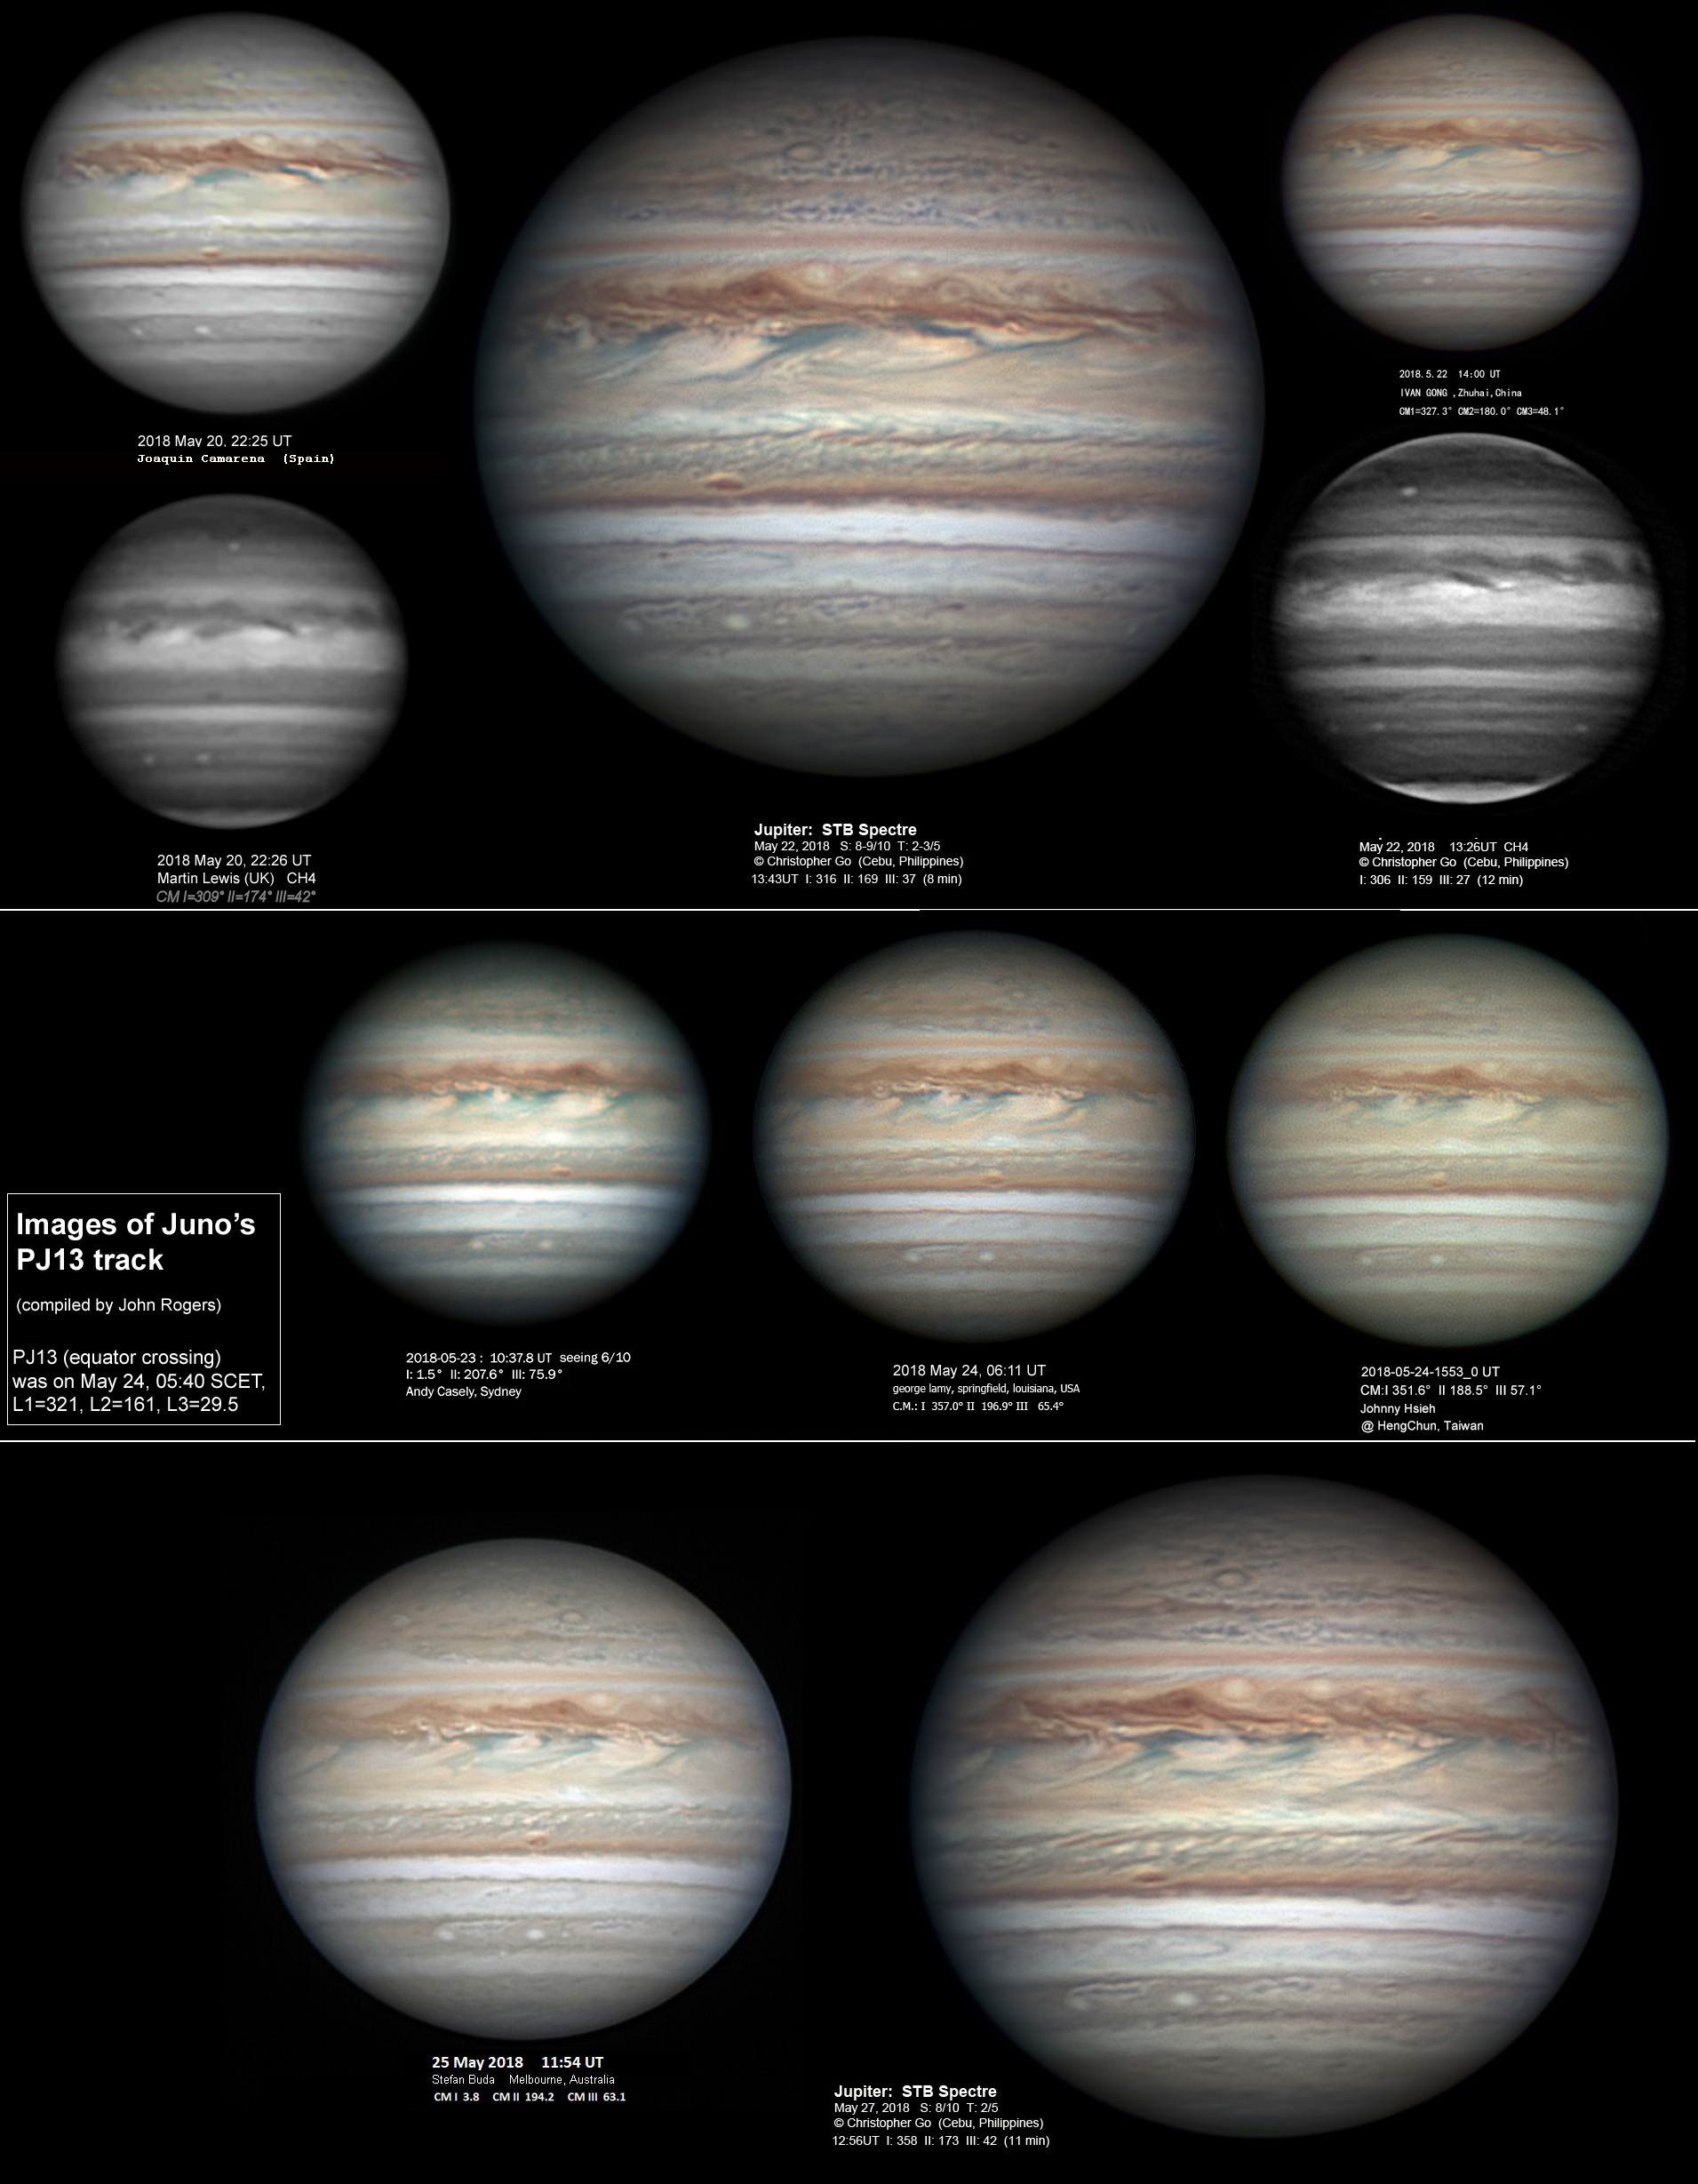
Figure 3 is a set of images showing the PJ13 track for a week around the perijove date.
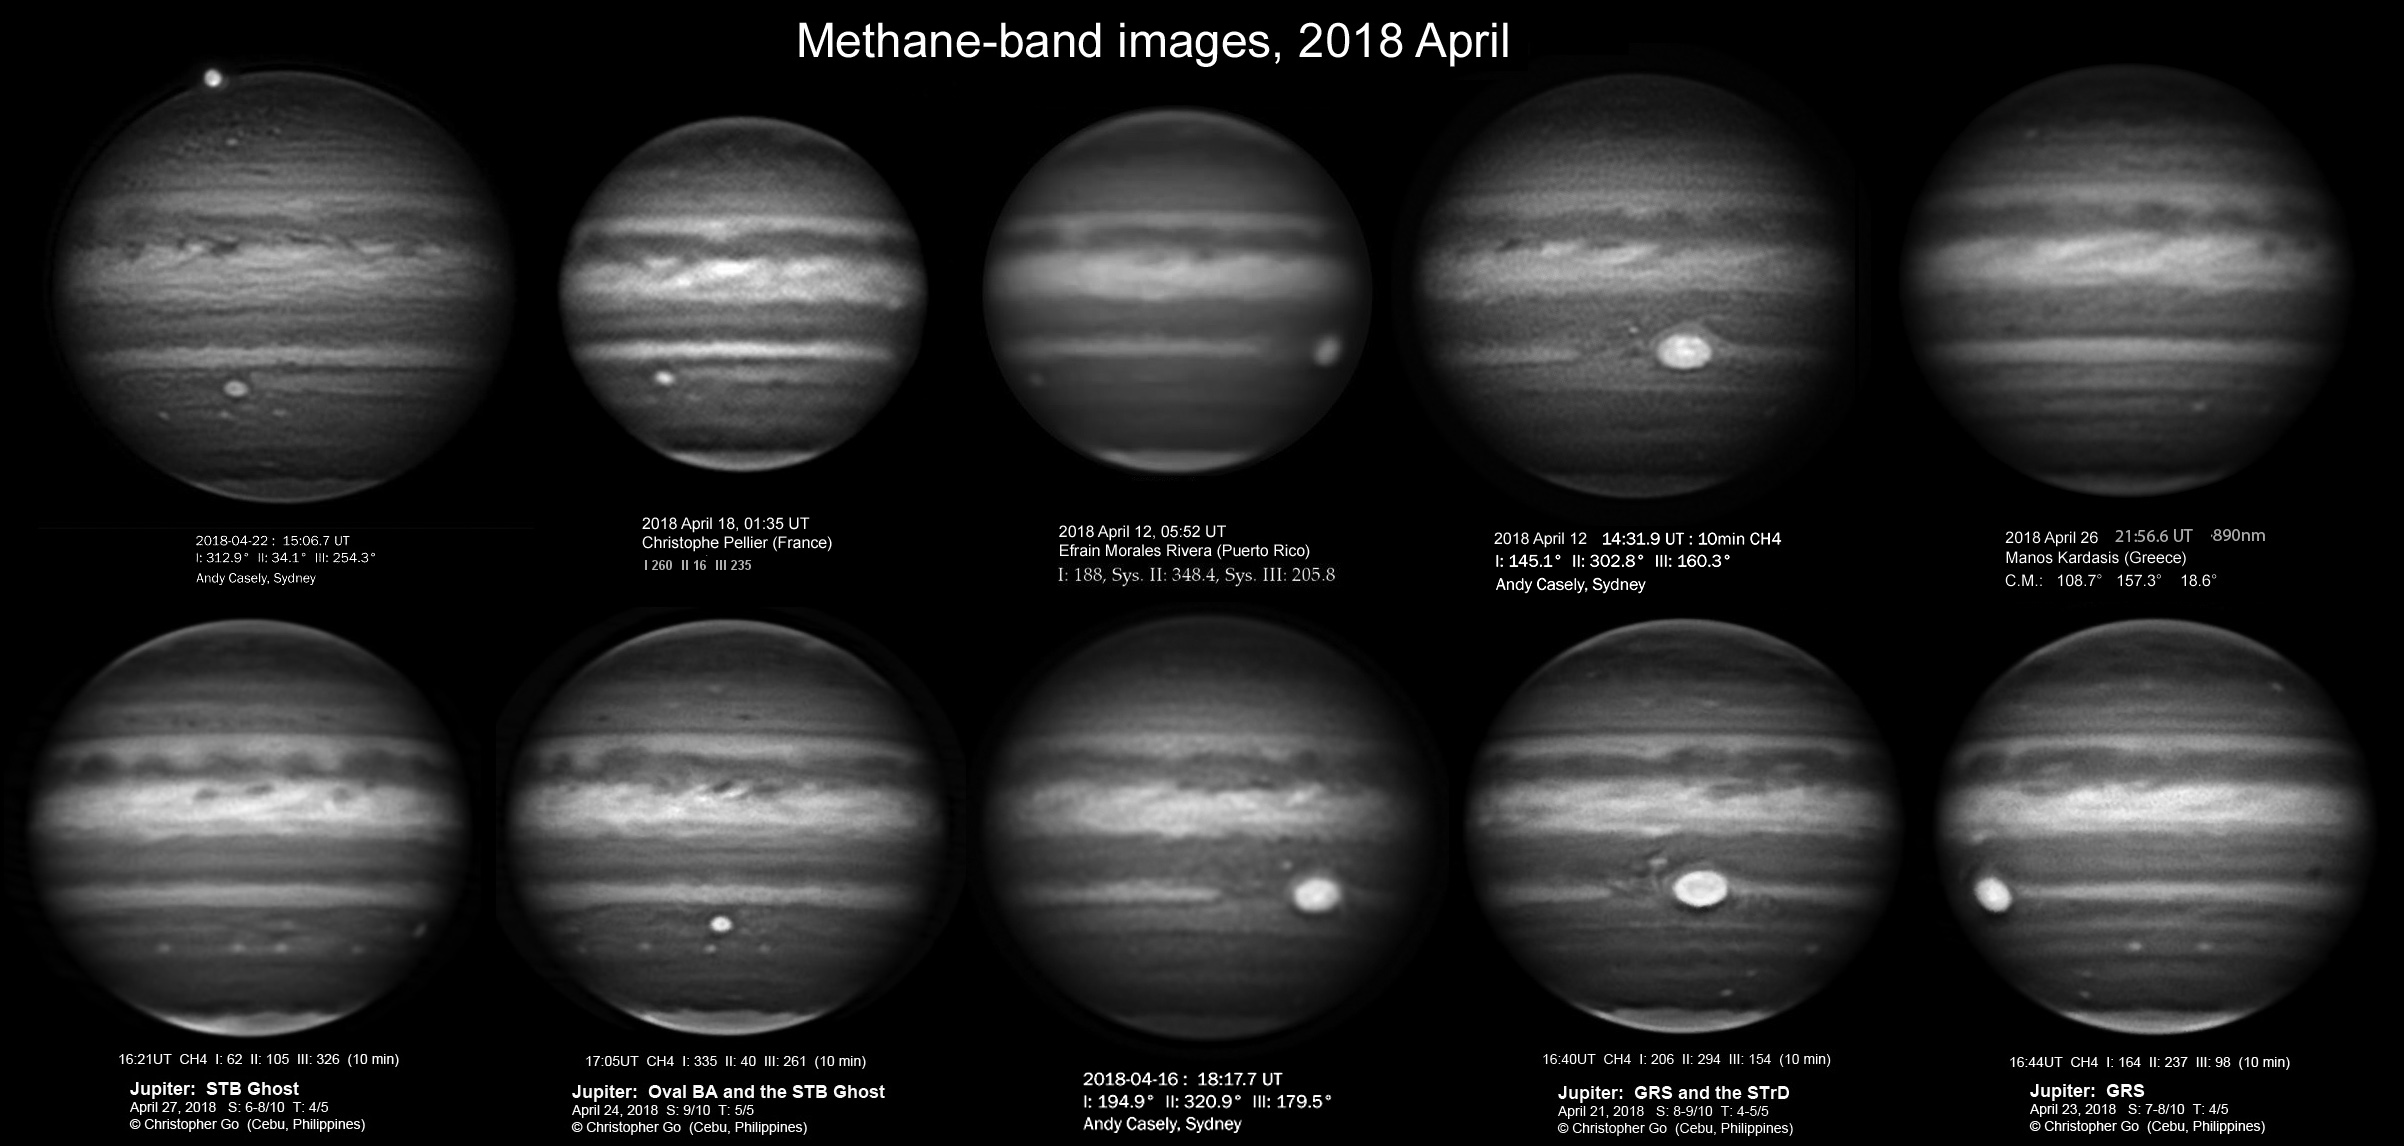
Figure 4 is a set of methane-band images around the planet.
Figure 5 is an animation of the STropD and GRS, 2018 March 30 to April 7 (from maps made by Michel Jacquesson).
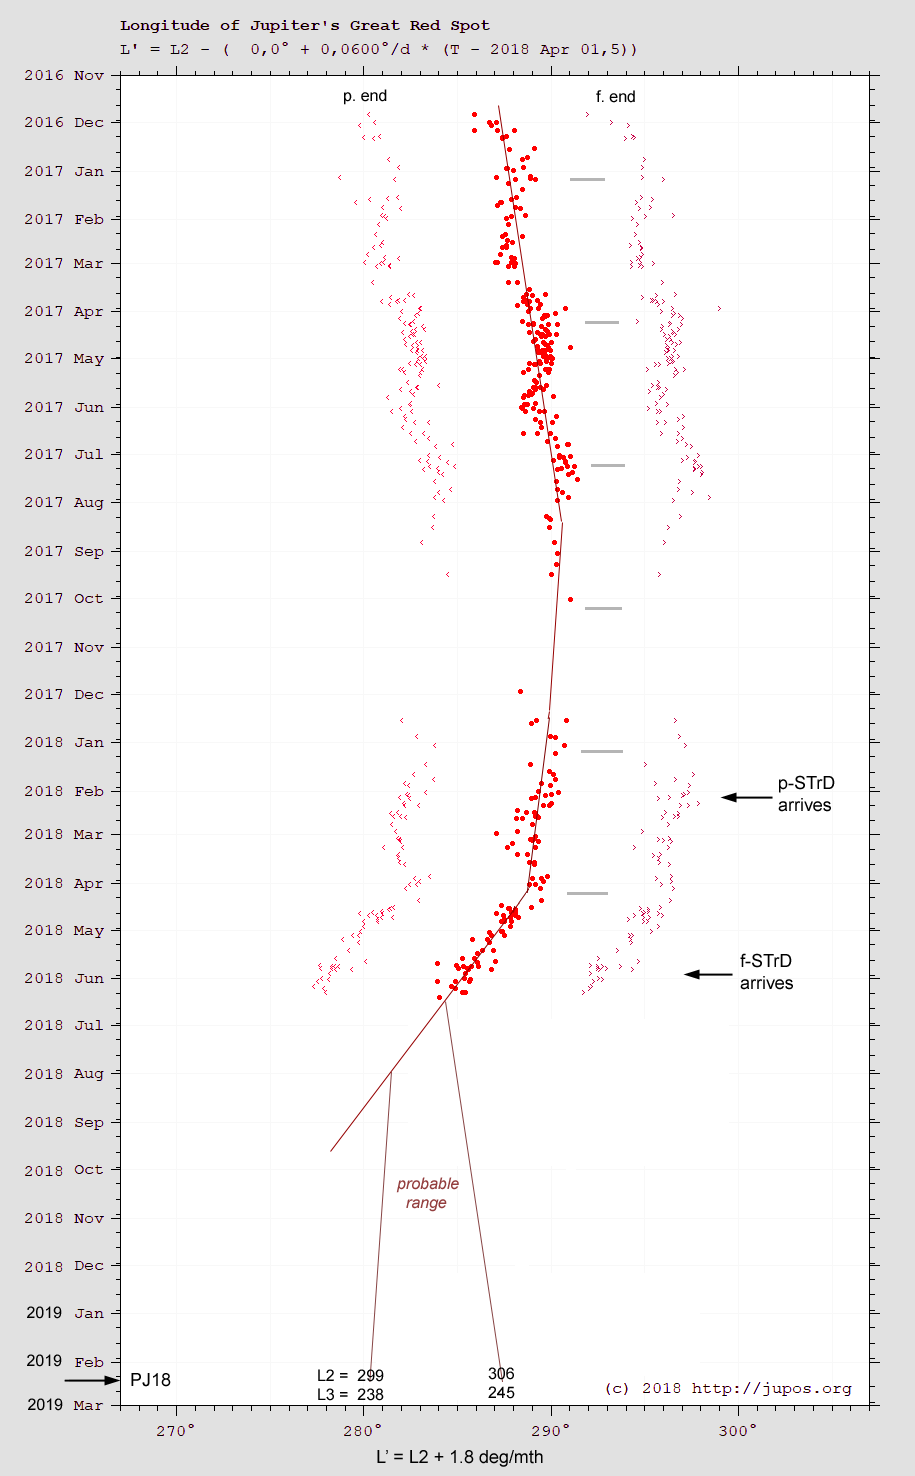
Figure 6 is a JUPOS chart of the GRS, extrapolated to PJ18 (2019 Feb.12).
North is up in all these figures. I am very grateful to everyone who has provided images.
The full report is posted here: Report-no-5_2018june.pdf
APPENDIX: Historical records of the Great S. Tropical Disturbance (STropD) passing the Great Red Spot (GRS), 1902-1913.
This Appendix is posted here: STropD_historical review-JHR.pdf
Here are the figures of the main report:
| The British Astronomical Association supports amateur astronomers around the UK and the rest of the world. Find out more about the BAA or join us. |