Jupiter in 2021/22, Report no.7: Equatorial Region Update
This is an update on two unusual phenomena that we have been observing recently in the equatorial region. We are very grateful to all the observers who have contributed.
The original version of this was posted on 2022 Jan.24. Since then, in view of further developments, we have revised Part II to include full details of the NEB(S) outbreaks around Juno’s PJ38 and PJ39 and up to the end of the apparition; so we are posting the revised report on Feb.23.
I. Slow-moving methane-bright patches on EZ:
In 2020, from amateur methane-band (889 um) images, we discovered an unprecedented pattern of waves on the EZ that were almost stationary in L3, and thus disconnected from the fast equatorial current. In 2021, similar features have again been observed, but instead of extended wave-trains, they are large isolated methane-bright patches that extend across the whole EZ. As in 2020, they move only slowly in L3, and are principally visible in methane-band images, although they are associated with the orange, UV-dark Equatorial Band (EB). Here we summarise the recorded examples and present compilations of images or maps covering them: one in May-June, three in August-Sep., one in Oct-Nov., and one in Dec-Jan. Below is a condensed version of one figure, and a rotation animation on one night, showing the three methane-bright patches in Aug-Sep.
II. Bright plume outbreaks in the narrow NEB(S):
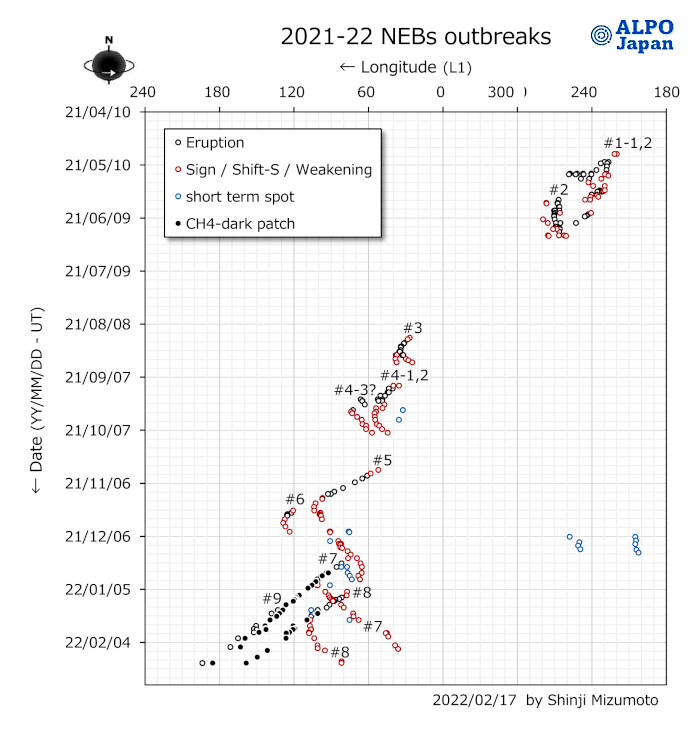
With the NEB in a very unusual state of paleness and quiescence, and a super-fast NEBs jet, these little outbreaks are the only sign of activity. Our Report no.6 described them up to 2021 Dec.4, including one directly observed by JunoCam at PJ38 on Nov.29. Since then, the same active sector has intensified with three more outbreaks starting on Dec.18 and Jan.6 and Jan.15, which are covered here; JunoCam again recorded the region at PJ39 on Jan.12. Below is a longitude chart of all the outbreaks. The increasing frequency and extent of the disturbance makes it imperative to observe the planet as soon as possible after solar conjunction.
Text of the report (revised): Report-2021-no7Rev_EZ-CH4&NEBSOs_text.pdf
Illustrations to Part I: Report-no-7_EZ-NEBS_Figures.zip
Illustrations to Part II (revised): Report-2021-no7R_NEBS_Figures.zip
Addendum to Part I (Drift measurements, posted 2023 Nov.): Report-2021-no-7_Addendum
Figures showing (A) Maps of the three methane-bright patches in Aug-Sep., aligned in L3; (B) ‘Rotation animation’ of the planet in the methane band on 2021 Sep.24, by Antonio Cidadao, showing the bright patches and other features; (C) Chart of the NEB(S) outbreaks, in L1.
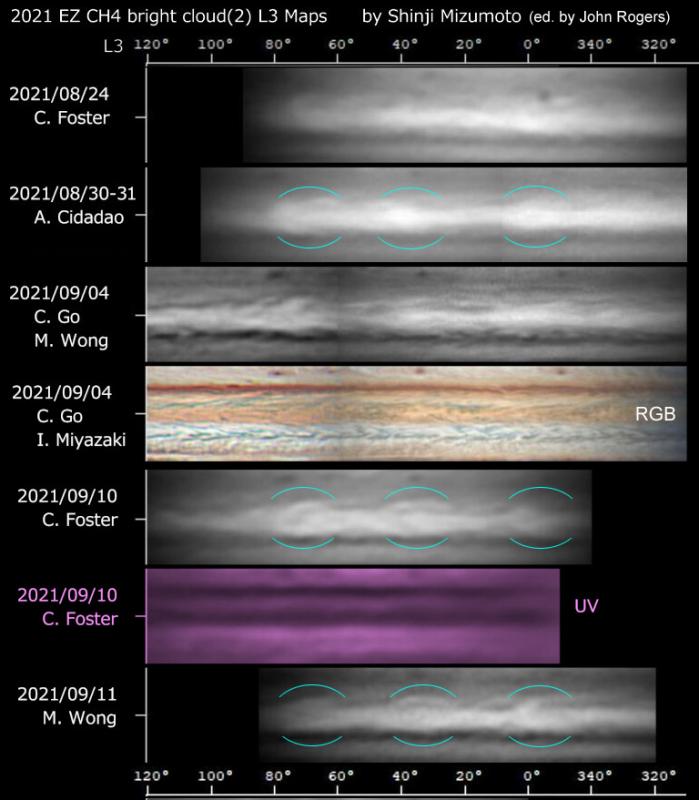
 Images at 889 nm & animation by Antonio Cidadao (Portugal), 2021 Sep.24.
| The British Astronomical Association supports amateur astronomers around the UK and the rest of the world. Find out more about the BAA or join us. |