Report no.5 (NTBs outbreak)
Jupiter in 2024/25, Report no.5: The NTBs jet outbreak
John Rogers1, Shinji Mizumoto2, Gianluigi Adamoli3, Rob Bullen3, Grischa Hahn3, Michel Jacquesson3, Hans-Jörg Mettig3, & Marco Vedovato3
(1) BAA; (2) ALPO-Japan; (3) JUPOS team (2025 April 16)
____________________________________________________________________
The NTBs jet outbreak has been very impressive and fascinating, so much so that we did not have time to post interim reports. This report combines everything that we have learnt about the process. A preliminary abstract was posted here on March 10, and is now superseded by the full report, with the revised summary below.
Full report text (PDF): Report-no5_NTBs-outbreak_final
Figures & Tables — small copies (PDF): Report-no5_NTBsO_MiniFigures&Tables
Figures — full size (ZIP): Report-no-5_NTBsO_Figures
Appendix 1: Maps by Shinji Mizumoto (ALPO-Japan). In this ZIP file are his map sets with some annotations and additions by JHR for tracking individual spots: Report-no-5_NTBsO_Appx1_Maps
The original maps are on the ALPO-Japan web site, direct link: https://alpo-j.sakura.ne.jp/Latest/j_Cylindrical_Maps/j2025%20NTBs%20OB%20mapsL1.htm
Animation of these maps by Mizumoto is shown below.
Appendix 2: Zonal wind profiles by Grischa Hahn (JUPOS team). The complete ZWPs from 2024 Nov. and 2025 Feb. are in this PDF: Report-2024-25-no5-Appx2_ZWPs
_____________________________________________________________________
Summary
The NTBs jet outbreak, predicted to occur in 2024 or 2025, duly appeared on 2025 Jan.10 (see Report no.4). These events are currently occurring every 4-5 years, and are among the most spectacular, energetic, and fast-moving phenomena on Jupiter. It has unfolded in exactly the same way as previous such outbreaks, and given us new insights into the processes.
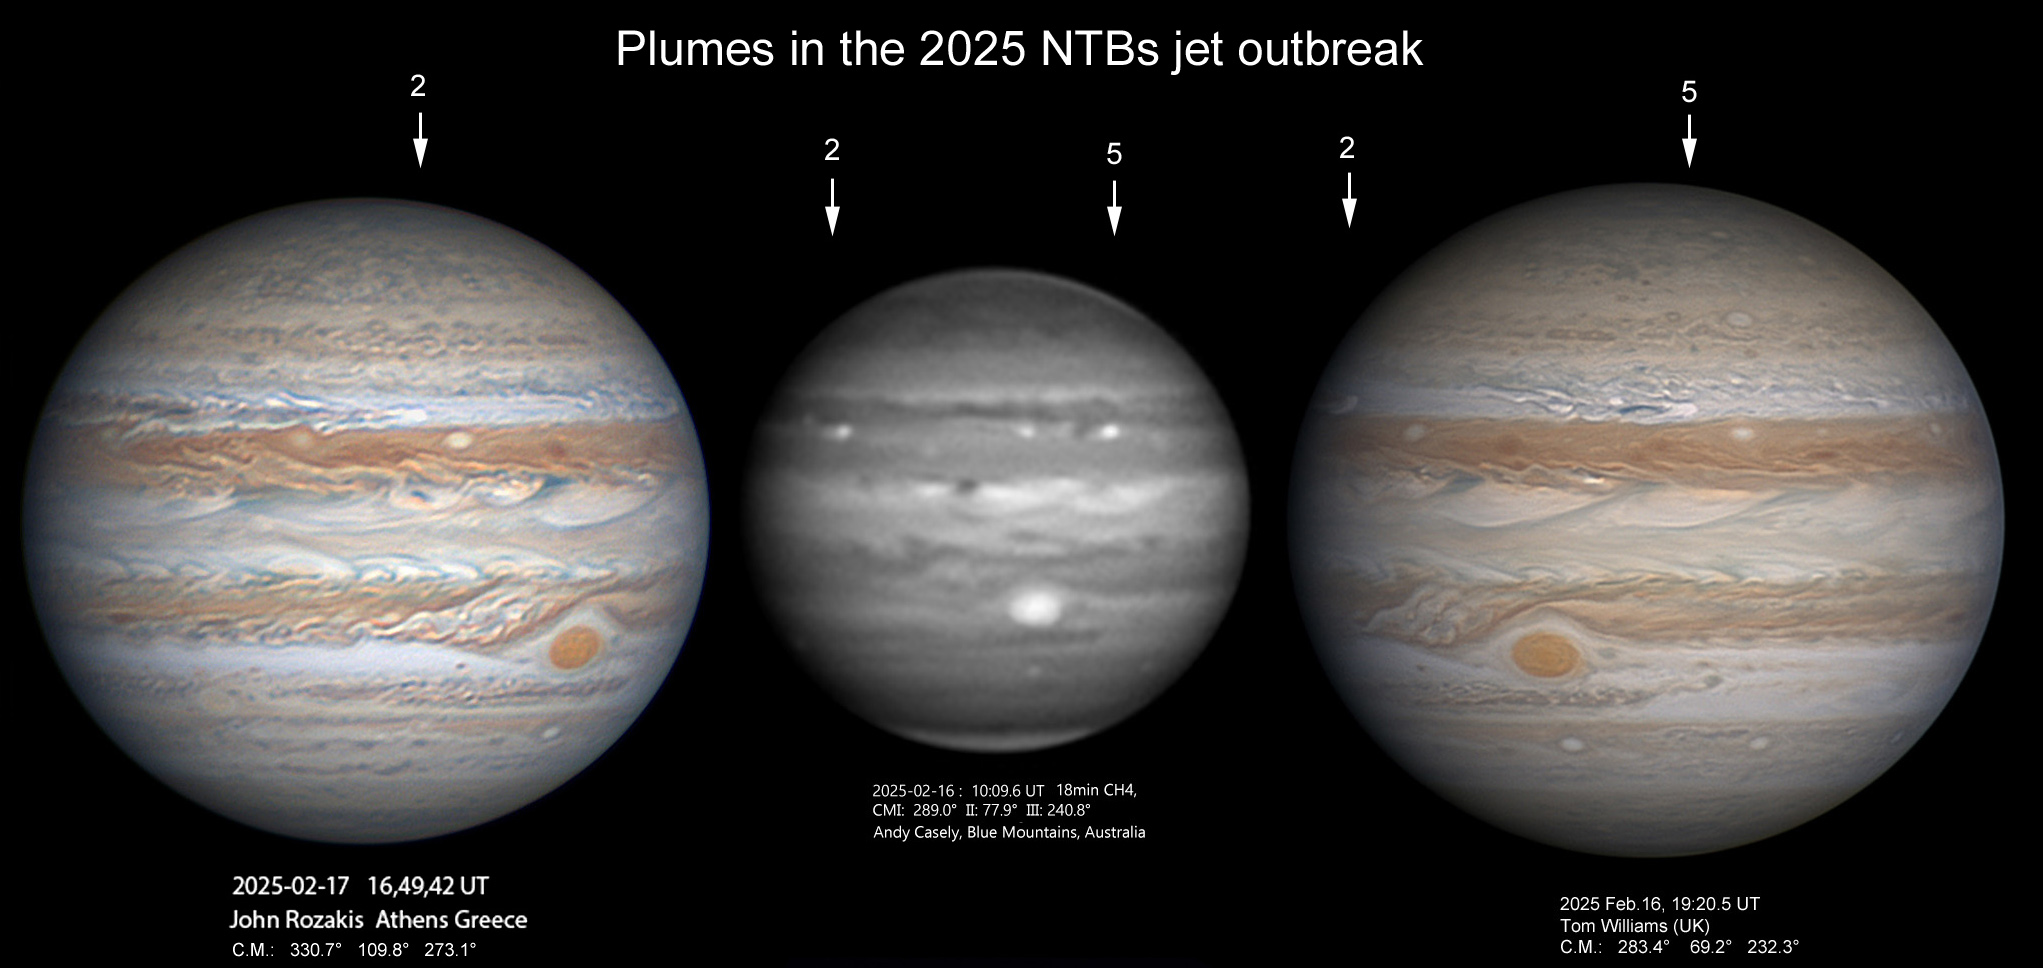
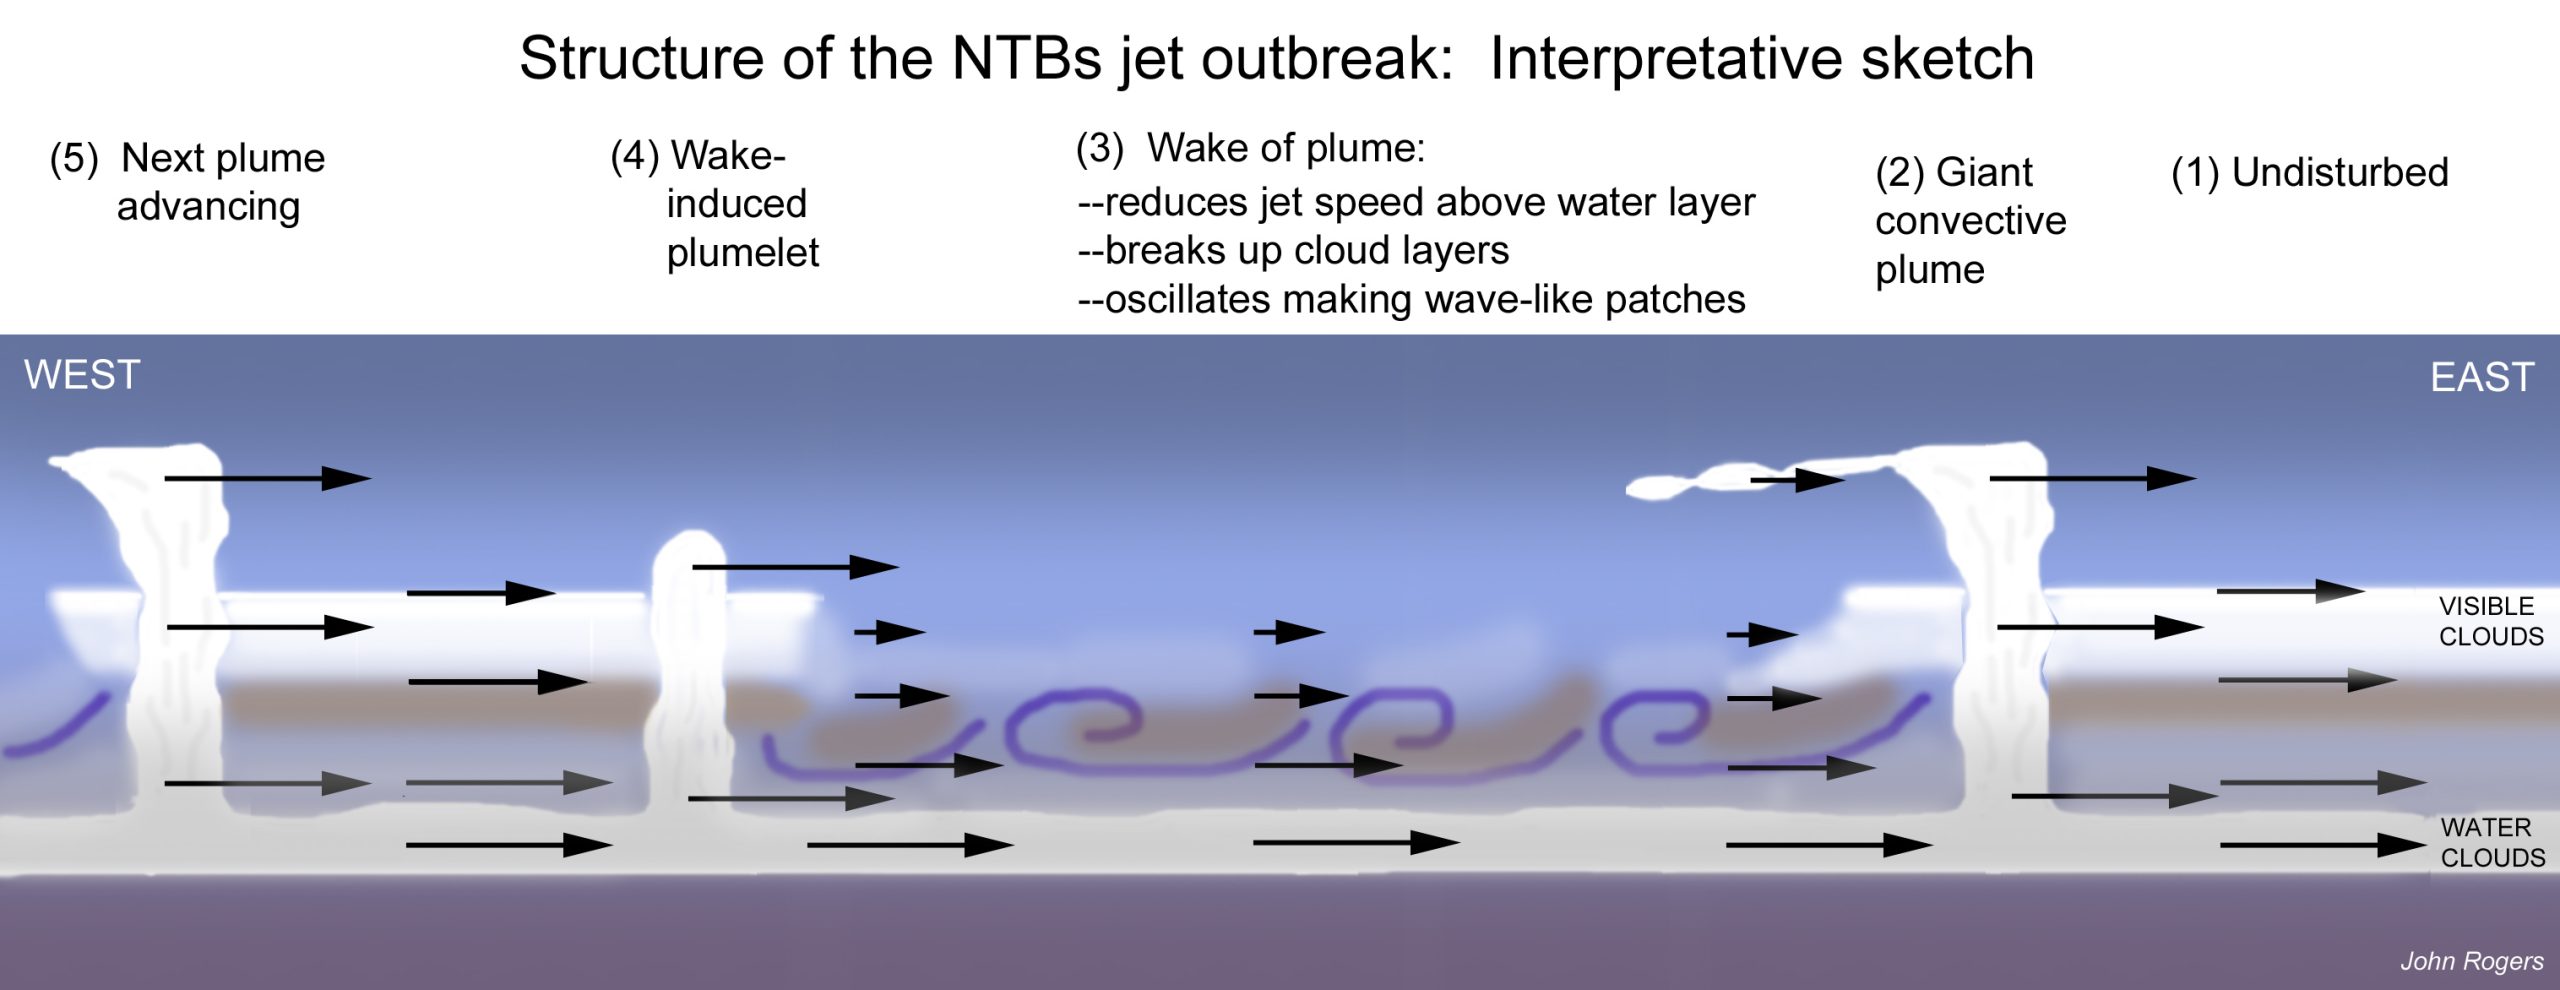
It began, as always, with the appearance of a small bright spot which rapidly grew to be the brightest feature on the planet at all wavelengths from UV to IR and in the methane absorption band, indicating that it was a convective plume rising to very high altitude. This plume accelerated over the first few days, then maintained a constant drift of -5.0 deg/day in System 1 from Jan.14-31, which is typical for these super-fast outbreaks. Up to Jan.31 it was still super-bright at all wavelengths, esp. the methane band, and it created a long expanding wake following it like a comet’s tail. The wake contained large dark patches which appeared periodically, and small bright spots on the north side, most of which moved with speeds close to System 1. There were also small bright, methane-bright spots arising at the following end, accelerating to speeds similar to the main plume but short-lived. We show that these “wake-induced plumelets” are a typical feature of these outbreaks.
On Jan.27 a second such plume appeared, only 20º preceding the first, and rapidly became as bright as the first, with almost identical speed.
On Feb.1-4, the first plume caught up with the wake of the second, and disintegrated within a few days, leaving plume 2 leading a very long turbulent dark wake. Meanwhile several more wake-induced plumelets appeared shortly following the wake, persisting for between 3 and 10 days , and on Feb.9, plume 5 appeared in a largely undisturbed sector, and grew to become another independent plume. In total, we numbered eight such storms, of which numbers 1, 2 and 5 were independent primary plumes, and the others were wake-induced plumelets, although number 4 could be an intermediate case. Plumes 2 and 5 persisted until late February, when each caught up with the wake preceding it and rapidly faded, both disappearing by March 1.
All three primary plumes first appeared at 24.0-24.6ºN, then drifted south and accelerated within a few days, to remain at 23.3 (±0.3)ºN with sustained speeds of -5.0, -5.1, and -4.6 deg/day (plumes 1,2,5 respectively). As usual, they all broke up within a few days when they caught up with the wake of the next plume ahead.
It is thought that these outbreaks occur when sufficient available potential energy has accumulated below the thick cloud layer that whitens the NTB, and the plumes are giant convective storms erupting from the water-cloud layer, well below the visible cloud-tops. In the 2025 outbreak, JunoCam on Jan.28/29 directly imaged lightning in plume 1. The convection can no longer be sustained where these storms have disrupted the pre-existing vertical atmospheric layering, so they break up when they reach the wake of the next plume. We suggest that the wake-induced plumelets (which we have also observed in some previous outbreaks) are similar plumes triggered by the approach of the following end of the wake, but in this situation they are less intense and are short-lived. The periodic dark patches in the wake appear to be wave features travelling more slowly than the jet.
The plumes and other white spots all fit a zonal drift profile which peaks at 23.3ºN, DL1 = -5.1 deg/day (u3 = +166.6 m/s), thus extending to faster speed and lower latitude than most zonal wind profiles (ZWPs) from spacecraft. ZWPs have been produced by G. Hahn from amateur images just before and after the present outbreak. In 2024 Nov., the peak was 150 m/s at 23.5ºN (slightly faster than the long-lived grey streaks that were tracked at 23.3ºN). In 2025 Feb., the earliest profiles yet produced during an outbreak – covering the wake – range from a narrow peak at ~141 m/s to a broad peak at ~126-136 m/s. When compared with previous ZWPs from spacecraft, these profiles establish consistent behaviour of the jet through the 4-5-year cycle of upheavals. They confirm that the super-fast plumes and plumelets erupt from and move with a deeper super-fast jet, but other features at cloud-tops do not achieve this speed. The jet shows no systematic change during the year before the outbreak, and no detectable acceleration of the cloud-top ZWP during the outbreak apart from the plumes themselves, and broadening on the flanks of the wake; instead, it quickly collapses to a slower but sometimes broader state, then recovers over the next two years or so. In 2024-25 there was somewhat slower ZWP before the outbreak (as also in 2015-16) and somewhat slower plume speeds (as also in 2020) – perhaps connected to the reduced interval between outbreaks.
The NTBn retrograding jet also accelerated just before and during the 2025 outbreak.
___________________________________________________________________________
Here is an animation of the whole outbreak, from maps in L1 made by Shinji Mizumoto:
Excerpts from the figures:
| The British Astronomical Association supports amateur astronomers around the UK and the rest of the world. Find out more about the BAA or join us. |