JunoCam at PJ45: Europa
JunoCam at PJ45: What the images show. Part I: Europa
John Rogers (BAA) (2022 Oct.9)
Juno’s perijove-45 (PJ45) occurred on 2022 Sep.29. Seven-and-a-half hours before the perijove, the spacecraft had its first close encounter with Europa, flying just 352 km above the moon’s icy surface. As it receded, JunoCam was able to get four images, showing a side of the moon that was poorly covered by Voyager and Galileo imagery.
Our report is here as a PDF with small figures: PJ45-Report-1_Europa
The full-size figures are in this ZIP file: PJ45-Report-1_Europa_Figures
Here is a miniature of Figure 4, then the rest of the text of the report:
In addition, Juno’s Stellar Reference Unit – a very sensitive camera used for star tracking, but also capable of detecting faint features like Jupiter’s ring and jovian lightning – took a hi-res image of Europa’s dark side illuminated by jove-shine, spanning ~150×200 km (Fig. 1).
Small copies of the four JunoCam images are shown in Figure 2. Figure 3 is a part of image 1, processed by Brian Swift, showing nice examples of a chaos area (brown, but not sunken) and a large pit.
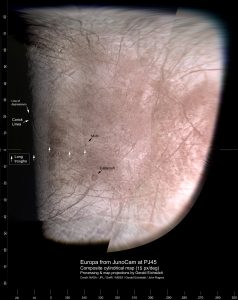
The four images were projected into cylindrical maps by Gerald Eichstädt, and Figure 4 is a reduced-resolution composite of them, with some features labelled. (Gerald’s original maps, as well as a larger-scale, unlabelled version of this one, are on the JunoCam web site in the ‘Think Tank’ pages.)
Impact features are rare: this map shows one large one (Callanish, which was viewed at high resolution by the Galileo orbiter), and possibly a small one (Midir, not yet viewed at hi-res). The general texture of ridges and bands and chaos regions is ubiquitous on Europa, but much of this area has not previously been imaged so well. There are swathes of cycloidal bands, dark in the northern and southern latitudes, and bright in low latitudes, where they have a different orientation.
White arrows indicate features that Paul Schenk and colleagues have argued may be signs of global stresses due to polar wander (global rotation of the crust) as shown in Figure 5 [adapted from Schenk’s ‘Atlas of the Galilean Satellites’; see figure for references].
There are four parallel long troughs (plus a near-parallel line of depressions between two of them). Two of these were proposed by Schenk as arcuate troughs concentric to the disrupted region centred at 300°W, 10°N, due to stresses of polar wander, and the pattern is seen here to be continued further.
Corick Linea, a sinuous bright band, was proposed by Richard Greenberg as an antipodal twin of the great Agenor Linea, which is thought to be a convergence zone. This image shows a previously unstudied extension of it; but it is much narrower than Agenor, and trends north of the disrupted region rather than towards it, so its relevance is not so clear. Corick Linea runs across the chaos region in Figure 3, but in a somewhat disrupted manner, so the chaos may actually be younger.
__________________________
| The British Astronomical Association supports amateur astronomers around the UK and the rest of the world. Find out more about the BAA or join us. |