Juno at Perijove-3: The south polar pentagon animated
[Note: This was originally posted on 2017 Jan.11, after Perijove-3, but was not made public until 2018 March 7, when the results on the CPCs were published in Nature.]
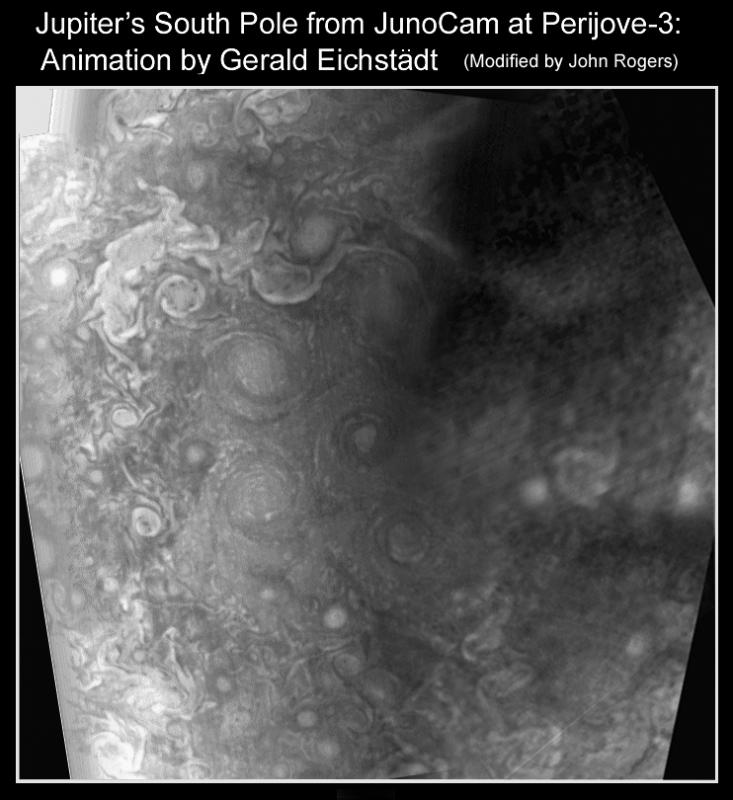
Animated maps of the South Pole, produced by Gerald Eichstädt from the Perijove-3 images, beautifully show the circumpolar cyclones (CPCs) and, for the first time, their clockwise circulations! This is a modified version of Gerald’s animation, which he posted on the JunoCam web site. Because his projections were not strictly polar, I have applied arbitrary re-scaling and shearing of the images to visually improve the alignment. (There may still be some distortions.)
Previously the CPCs were only seen in the images directly over the pole, with only one hemisphere illuminated, but by map-projecting later images as well, to give a total duration of 3 h 20 m (one-third of a jovian day), Gerald has revealed the CPCs all around the pole There are indeed 6 CPCs; 5 are symmetrically placed around the sixth, central, dark one (in the centre of the frame). The exact location of the pole is still not certain, but I believe it must be in the centre of that central cyclone. So Jupiter has a pentagonal (not hexagonal) pattern around its south pole.
Illustrations (below):
Figure 1: The animation.
Figure 2: A merged composite of the maps in the animation, showing the five cyclones in a pentagonal pattern around the sixth. (One of the five is only dimly seen at low resolution.) Outside the ring of five, there are some small AWOs, and many less-regular cyclonic turbulent regions which cover most of the region.
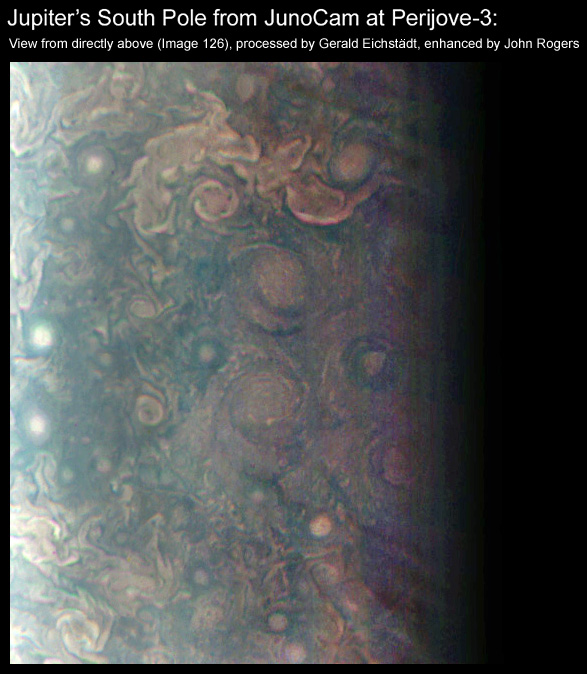
Figure 3: An enhanced version of the best colour image, taken directly over the south pole.
Credit: NASA / SwRI / MSSS / Gerald Eichstädt / John Rogers
| The British Astronomical Association supports amateur astronomers around the UK and the rest of the world. Find out more about the BAA or join us. |