2023 July 28
Visual observation of Jupiter
Introduction
Jupiter is now embarking on its most favourable apparition for many years for northern-hemisphere observers, reaching a declination of 15°N in the autumn and a disk size of 49.5” at opposition on 2023 Nov.3.
This giant planet must be one of the most rewarding objects to look at through a telescope. It has a large bright disk, with prominent belts and spots, often quite colourful, and its appearance changes on every timescale from minutes to years. To observe it you don’t even need a fully dark sky, although you do need reasonably good seeing.
Nowadays, almost all the scientifically useful work of the Jupiter Section is derived from digital images. However, photography only began to surpass the resolution of visual observation in the mid-1980s. It was visual observers who defined the main features and phenomena of the planet more than a century ago, and we can still get great pleasure from watching and recording them. Visual drawings and descriptions of the planet’s appearance can still give a useful record for comparison with the historical record. And an observer may notice the onset of a new storm, or even an impact flash.
So how can observers get the best out of visual observing, both for themselves and for possible contribution to knowledge?
What can you see?
The main belts and zones are visible even with an 8 cm telescope, but you will need at least 15 cm aperture to see a good range of features; 25-30 cm gives an excellent view. The best magnification will vary depending on the seeing and on what you find comfortable, but values from x170 to x300 are typical.
Jupiter’s disk is bright and its contrast is lower than is usually shown in images, so your eyes may take a little time to get accustomed to it. Soon you should see not only the main belts, but also narrower bands towards higher latitudes, dark ‘projections’ along the edges of some belts, and dark or white ‘spots’ in various latitudes. These are all weather systems, and the main aim of the Jupiter Section’s observations is to document and interpret the complex regularities in their behaviour.
Over a matter of minutes, you see the planet rotating and often one of its four great moons passing in front of it. Over days or weeks, its atmospheric weather systems move and evolve. And over years, great climatic cycles unfold in recognisable patterns – for example, the fading of the North Equatorial Belt (NEB) and the orange coloration of the Equatorial Zone (EZ) that were evident in 2021 (Figure 1). The belts and zones can be quite variable (e.g. Figure 1), but always revert to the same latitude bands, in which they are bounded by permanent jet streams. The standard positions and abbreviations of the belts and zones are shown in Figure 2. (South is up in the illustrations in this article, as our visual observers are all in the northern hemisphere and generally draw the planet with south up, although we now put north up in our regular reports.)
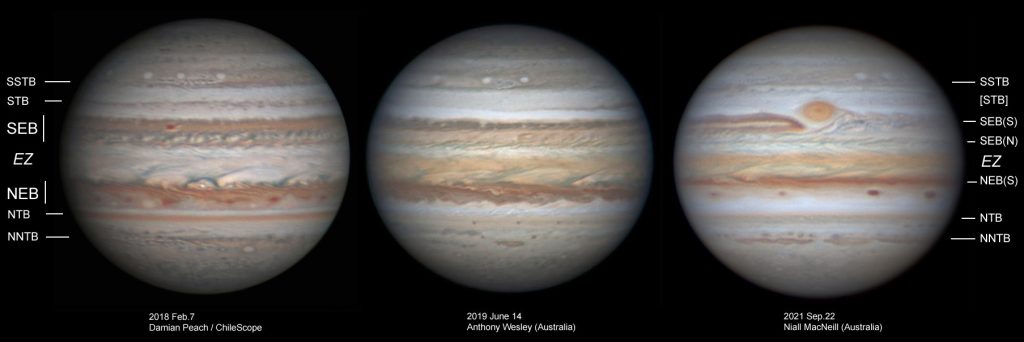
Figure 1. High-resolution images of Jupiter in 2018, 2019, and 2021, showing the large colour changes that were occurring in the North Equatorial Belt (NEB) and Equatorial Zone (EZ). South is up.
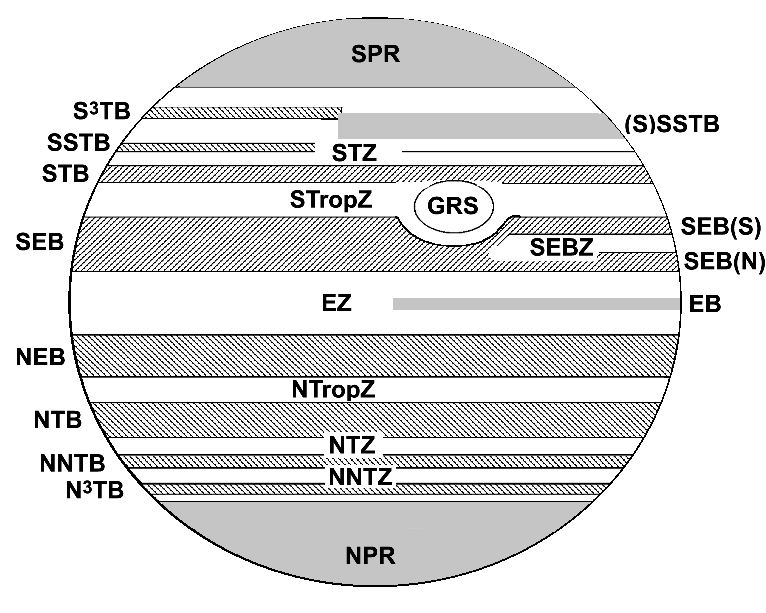
Figure 2: Standard latitudes and names of belts and zones. The equatorward edge of each belt is drawn at the latitude of the eastward jet stream that normally confines it; indeed, nowadays we use the latitudes of the jet streams to define the belts. However, the visibly dark belts can temporarily change their width or fade (Figure 1) Visual observers will need to refer to the visibly dark belts in the traditional way, but note if they appear abnormal. (South is up in all figures in this article, because that is how most of our visual observers see the planet, but in our regular Section reports since 2015 we show the planet with north up.)
Observing the planet’s weather systems
Since quantitative work is now best done from images, the most useful visual work is to record the appearance of the planet in the traditional ways, for comparison with historical records. This can be done by drawings and by colour descriptions. Also, if you are interested in identifying and tracking specific features, you can measure their longitudes by transit timings.
(1) Drawings
Drawing at the telescope requires some practice, but is a very satisfying way to record your observations. Some recent drawings are in Figures 3 & 4. (Some people nowadays use the word ‘sketch’ for any drawing, but to me, a sketch is a rough and possibly inaccurate thing, not worth publishing.)
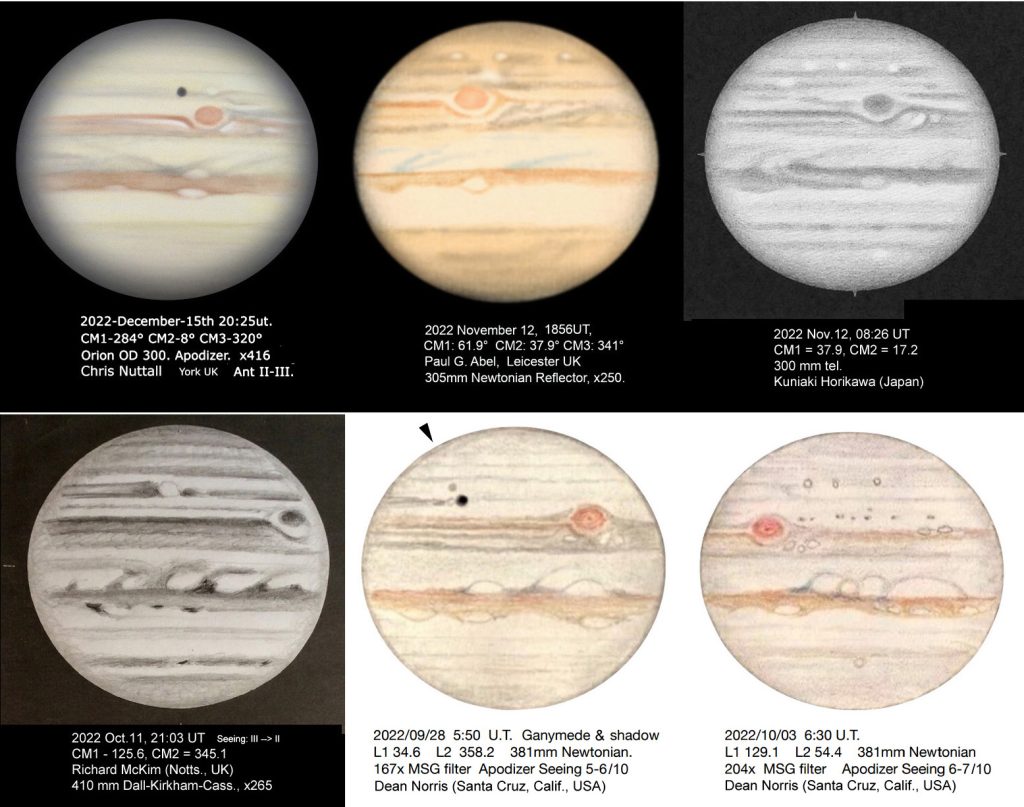
Figure 3. Some drawings from Section members in 2022-23; a selection all showing the Great Red Spot.
At the telescope, you will probably make a sketch which can be worked up into a final drawing later, correcting inaccuracies based on notes you made at the time. You start with a blank oval outline (e.g. from the BAA report form) on which you can lightly mark the standard belt positions in Figure 2 as a guide (shifted up or down depending on the small tilt of the planet), but note that some belts may well have different widths or be invisible when you observe them. Because Jupiter’s rotation carries features across the disk rapidly, the recommended procedure is as follows. First look at the planet carefully so as to see the general layout and the most possible detail in the best moments of seeing. Then start by sketching in the belts, consciously estimating their distances apart so as not to make them too small or too large. Then, draw in the principal spots in their correct positions, within a minute, to define the exact time of the drawing. Then fill in the details, and make notes on colours and intensities. The limb-darkening should be represented.
Your final drawing can be worked up either traditionally in pencil, perhaps using coloured crayons, or in digital form if you are skilled in using a graphics program.
Of course, it’s important to draw only what you see, not what you expect to see. The contrast and clarity of the markings has to be somewhat exaggerated to record them clearly, so there are inevitably differences in style between observers. Some people have more artistic skill than others, and accurate and beautiful drawings are much appreciated. Nevertheless, the aim (for the BAA) is not to report the most detail or to produce the most beautiful artwork, but to record what is actually visible. Most observers will inevitably be familiar with recent images, but you should try not to be influenced by them – even though this may be difficult. For instance, the small white ovals in the SSTB were hardly ever seen as such before the 1980s, but are shown by several of the observers in Figure 3. Once seen in spacecraft images, they are difficult to unsee.
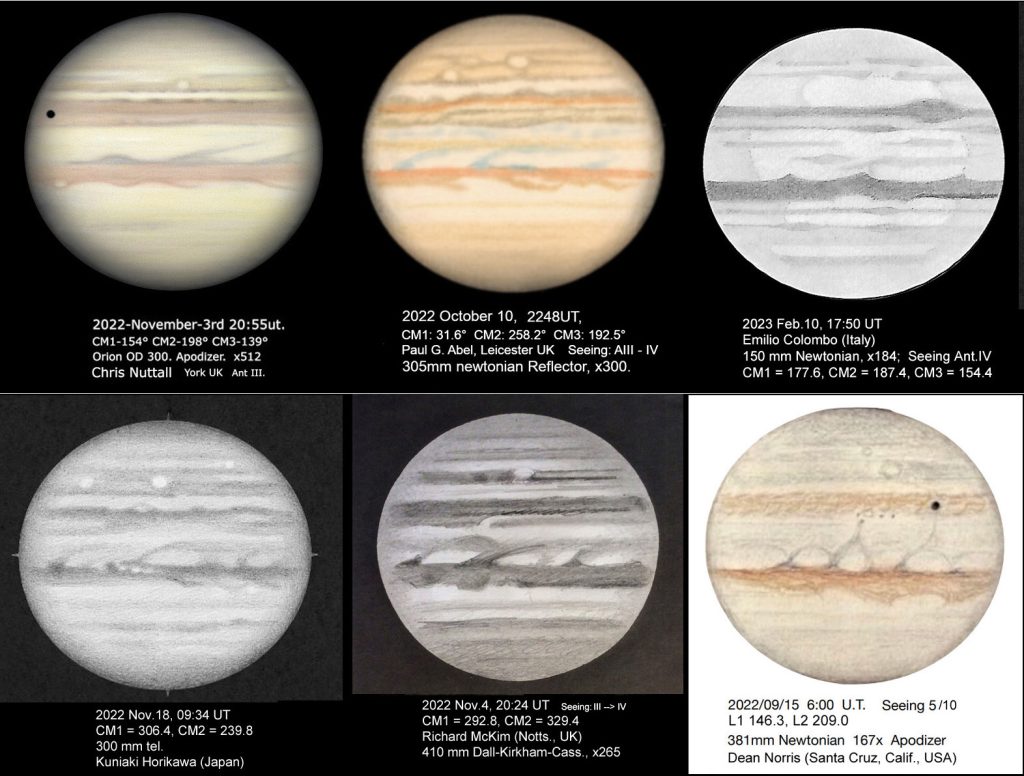
Figure 4. Some more drawings from Section members in 2022-23.
(2) Colour and intensity estimates
Although images contain much information about colours and intensities (brightness) of Jupiter’s features, these may be distorted in the processed, sharpened images that are usually posted, and until now they have only been assessed by subjective description, just as a visual observer does. Christophe Pellier has now developed methods for measuring colours and intensities objectively, by making calibrated scans of unprocessed images in several well-defined filters, but this has not yet been adopted widely. Therefore, visual estimates are still potentially useful. You need to have good resolution, with a telescope of at least 25 cm aperture in good seeing, and to be as precise as possible about the identities of the belts; a drawing or sketch can be helpful. The time of the estimates must be noted.
Colours are recorded descriptively, for each belt and zone. The telescope should preferably be a reflector, as a refractor can introduce spurious colours. The planet needs to be high enough to give good seeing and to avoid colour fringing due to atmospheric dispersion (which affects the boundaries of belts as well as the limb of the planet). One should be aware that the colour contrasts between regions can distort the apparent colours, as the eye does not have an absolute colour reference, but there may be no way of avoiding this.
Intensities of belts and zones are recorded on a scale from 0 (white) to 10 (black) although this can only be a relative scale rather than an absolute one. Again the estimates will be influenced by contrast effects, and by the widths of the belts.
The visual impression of colours can be complemented by viewing the planet through different filters. In a blue filter, reddish regions are darkened so the contrast between the mostly brownish belts and the white zones is enhanced, while distinctly red regions like the Great Red Spot appear very dark. In a red filter, reddish regions look brighter, while bluish features such as the north equatorial dark formations appear darker.
Because colour and intensity estimates are subjective, with different observers adopting different scales, they are only worthwhile if done repeatedly during an apparition by a single observer. Then, at the end of the apparition, we ask each observer to tabulate their results in a report giving average values, for submission to the Section.
(3) Tracking atmospheric features by transit timings
Longitudes of spots can be measured by timing their ‘transits’ – i.e., the time at which the spot crosses the centre-line of the disc (the central meridian, CM). The observer should give the transit time to the nearest minute (which corresponds to 0.6° of rotation in longitude), and the CM longitudes (in Systems 1, 2 & 3) from the WinJUPOS software (Figure 5) or from the BAA Handbook. If you see a feature that you think is new and interesting, it is worth making a transit timing.
In the past, this was the principal way of tracking weather systems on the planet. Nowadays it is something that a regular observer can do out of personal interest: timing transits systematically through an apparition, accompanying them with sketches, and plotting them on charts to follow spots on their different currents over several months.
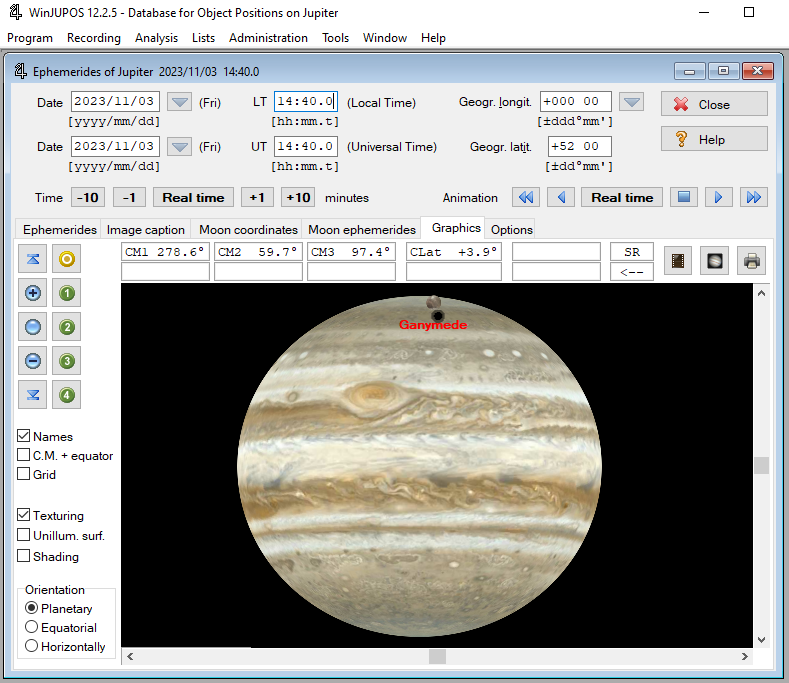
Figure 5. Screenshot of a page from WinJUPOS. The software is free and easy to install. If the time of observation in UT is entered, it will give the central meridian longitudes in Systems 1, 2 and 3. (System 1 refers to the near-equatorial regions, Systems 2 or 3 to the rest of the planet. We still use System 2 for tracking for convenience, but we also give System 3 for compatability with professional data.) It can also show a graphic view of the system with the moons and their shadows, as shown here. (The surface of the planet is only illustrative, not an actual prediction.)
Reporting observations
You should record your name, general location, telescope, magnification, seeing (Antoniadi scale from I to V), times of start and finish, and the time of the drawing or of colour estimates, with CM longitudes in Systems 1, 2 and 3 (preferably calculated using WinJUPOS). The Jupiter Section provides a report form that you can edit to suit the types of observation that you are making, at: https://britastro.org/jupiter/programme.htm.
If you make observations that could be useful to the Jupiter Section, we prefer to receive them as electronic versions. For a drawing, a good JPEG is ideal; your file might be a scan of the individual drawing or of the whole BAA report form, or a digital drawing. Whatever the format, there are important requirements that apply to drawings just as to electronic images. All the relevant data must be written on the image (not in a separate file or text). The filename must include year-month-date-observer, in that order, preferably in the format used by international image databases, e.g.: j2023-07-20_0121ut_ABC (where ABC is your initials or some other abbreviation of your name).
Please submit observations by email through “Contact the Director”, and/or by uploading to the BAA Members’ Gallery (which is copied to the Jupiter Section Gallery).
Observing impact flashes
Amateur webcam observers occasionally record a bright point flash on the planet, representing an impact from a miniature asteroid or comet in the 10-metre size range. They were unknown until 2010, but nine have been recorded in the 13 years since then (e.g. Figure 6). One of these was first reported by a visual observer (George Hall in Texas). If you do see such a flash – they typically last 1-2 seconds, and are at least as bright as a transiting satellite – it’s important to note the exact time and the location on the planet; then report it immediately, e.g. to the Section Director and on some public forum such as Facebook. Then, webcam observers can check any videos that they were taking at the time to see if they recorded it. Obviously, little weight would be given to a claimed visual sighting if the event had already been announced by someone else.
(Larger impacts produce persistent, very dark spots, as in 1994, but if you are new to Jupiter observing, please don’t suggest that any prominent dark spot you see is due to an impact – meteorological dark spots are very common and impact scars are very rare!)
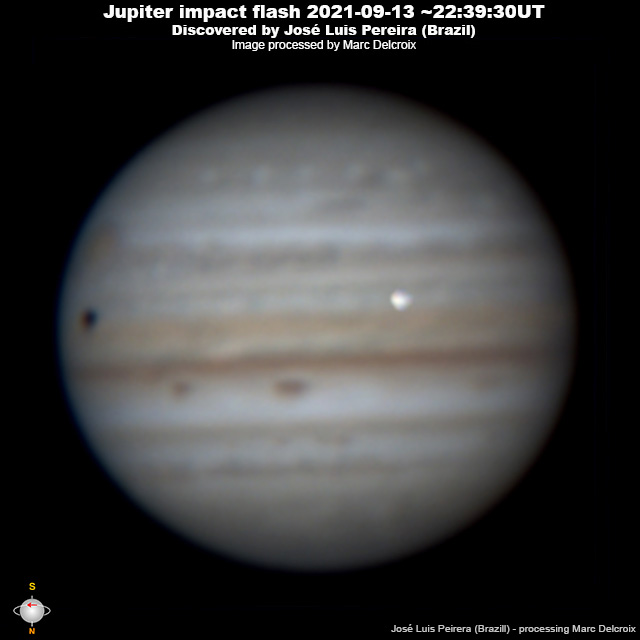
Figure 6. A Jupiter impact flash in 2021, captured by the planet imager Jose Luis Pereira.
Observing the satellites
The transits, shadow transits, eclipses, and occultations of the four galilean satellites are among the most striking phenomena that a beginner can observe. Although observations will not have any scientific significance, observers may like to make accurate drawings of these phenomena, especially when several are occurring at once. Exact times for them are given in the BAA Handbook, and synthetic views can be produced in WinJUPOS.
A date to note this year is Nov.3-4, within 24 hours after opposition, when observers will be favoured by three events. Io will transit in front of its shadow, then Ganymede will transit adjacent to its shadow (Figure 5), then Europa likewise. The Io and Ganymede events will be visible from Australia and the Far East; the Europa event, from Europe and North America.
______________________________________
John H. Rogers, Ph.D.
Jupiter Section Director,
British Astronomical Association
Email: < jrogers11@btinternet.com>
Web: https://britastro.org/sections/jupiter
______________________________________
Guides on our web pages
General guides to Jupiter’s features are available on the BAA Jupiter Section’s archived web pages:
- ‘Guides to Jovian Activity’ https://britastro.org/jupiter/guide.htm (including an illustrated guide by Damian Peach, 2003)
- ‘Jupiter on the eve of the Juno mission’ (2015/16 Report no.9) https://britastro.org/node/7741
- ‘Reference list of Jupiter’s jets’ (2013), explaining our present nomenclature https://britastro.org/jupiter/reference/jup_jets/ref_jets.htm
- A detailed guide to observing Jupiter, including a report form, was posted on our web pages in 2004 https://britastro.org/jupiter/programme.htm (but it is due to be revised, so this article supersedes it in some respects)
- You may also like to revisit Richard McKim’s tutorial on “Drawing the planets” (2020) on this web site https://britastro.org/2020/drawing-the-planets-some-tips-and-anecdotes
| The British Astronomical Association supports amateur astronomers around the UK and the rest of the world. Find out more about the BAA or join us. |