› Forums › Spectroscopy › Need help with instrumental response for low-res spectroscopy
- This topic has 23 replies, 3 voices, and was last updated 1 year, 11 months ago by
 Robin Leadbeater.
-
AuthorPosts
-
30 July 2024 at 8:38 am #623915
Magnus Larsson
ParticipantHi!
I’m fairly new to this forum, but I have been doing spectroscopy for a little while. Recently, I switched from a CCD to a CMOS camera on my low resolution spectrograph, a Lowspec with 300 l/mm grating, and since then I have problems in handling instrument response. I use a ZWO ASI183m camera, that according to tests by Christian Buil should be well suited for spectroscopy. I use a C8 at f/10 for acquisition of spectra.
Moreover: I capture flats with a 3D-printed device indoors, using a halogen lamp. This lamp is unfortunately quite weak in the blue end of the spectrum.
Now, my instrument response profiles have so far been produced with a standard procedure: acquire a spectrum of a ref star (in this case HD207673), produce a profile in ISIS, compare with a Miles library profile of the same star, divide and smoothen the result. Then when I include this profile in the processing of the same star, I get a very very good match. However, when I then process another star and compare that spectral profile to one found in the Miles library, they do not match.
Then I have tried following Christian Buil’s instructions for the CMED process for reducing noise in CMOS sensors: http://www.astrosurf.com/buil/UVEX_soft/
On this page, he describes using a prnu profile instead of the regular dark-offset-flat for calibration. As I understand it, this handles something of the weakness in blue with a halogen lamp.
But when I use a prnu profile instead of the regular process, I get the same results. See the attached image. I don’t know what is happening here – any advice or help is very warmly welcome.
In this folder are some relevant files:
https://www.dropbox.com/scl/fo/04ze3hyq1ypbqqbe8fqxv/AFDiWYuA2KWwo5RSLliFlns?rlkey=q2zeknvjs1ed6wp39w4vjtgna&dl=0HD207673 is the ref star from which I produce the response-profile. The response profile is included – this one produced with the prnu-profile.
There are also a few profiles from other Miles stars, produced using this response profile. I can not make them match the Miles spectra.I do hope this make sense and that I have not confused things here (been going through this process many times the last few hours).
Magnus Larsson
-
This topic was modified 1 year, 11 months ago by
Magnus Larsson.
Attachments:
30 July 2024 at 5:40 pm #623926 Robin LeadbeaterParticipant
Hi Lars
compare with a Miles library profile of the same star, divide and smoothen the result.
Are you doing this using the ISIS “response” and “continuum” functions using the MILES spectra in the ISIS database ?
Cheers
Robin30 July 2024 at 8:34 pm #623928Robin LeadbeaterParticipantTo put the problem into context I have plotted your spectra blue overlaid with the MILES spectrum. (attached). None of these stars are main sequence so are not ideal references as they may be variable. There are differences but it is not a complete disaster. Were they measured at the same air mass?
Cheers
RobinAttachments:
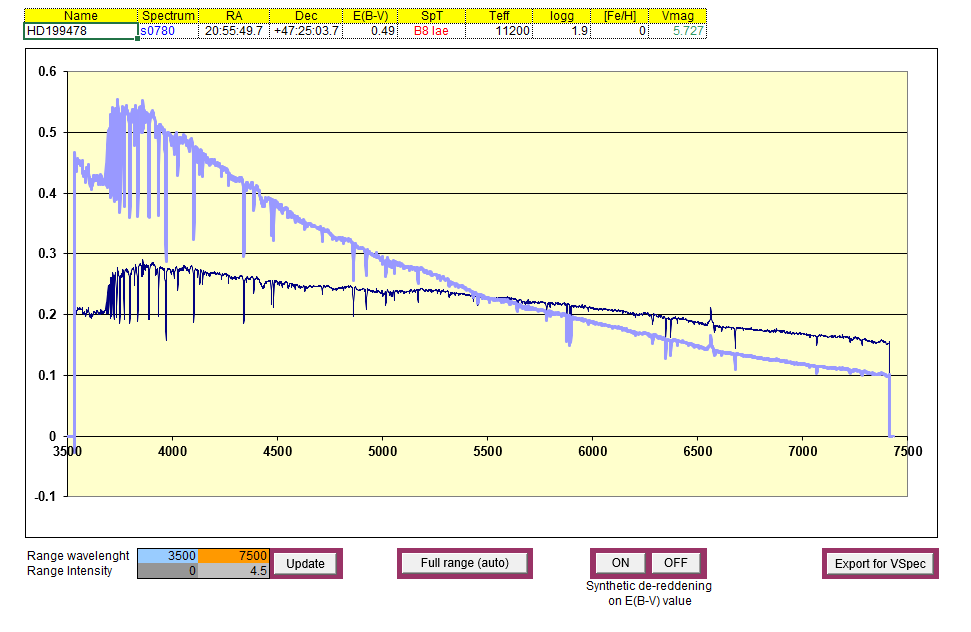
30 July 2024 at 8:39 pm #623930Robin LeadbeaterParticipantAlso HD199478 is very high extinction so best avoided
Attachments:
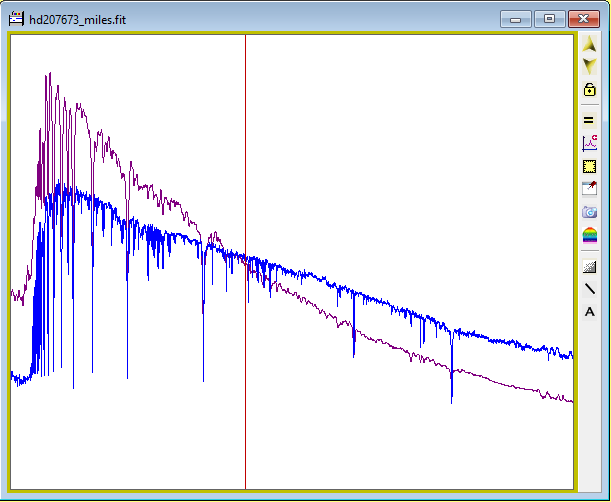
30 July 2024 at 8:49 pm #623932Robin LeadbeaterParticipantThe Miles spectrum of HD207673 also appears to be very reddened so probably best avoided
Attachments:
30 July 2024 at 10:52 pm #623934ParticipantHi Robin!
Yes, I am doing the Response and Continuum processes in ISIS. Exactly.
Best,
Magnus
30 July 2024 at 10:57 pm #623935ParticipantHi!
Yes, same air mass. They were identified as ref stars for SS Cyg, or rather HD207673 was and the others as supplement stars for checking precisely the instrumental response. They were observed at roughly the same air mass.
Very helpful indeed, with your analysis. May I ask: how do you determine the extinction and reddening? Very good to know.
Also: I came upon another hypothesis tonight: My profiles might be tainted by skyglow. I tend to take the ref star first, and in the bright summer nights here in Sweden, the sky is not fully dark (I have relied on ISIS being capable of handling that….). So it might be that the different profiles are captured at times when the skyglow was significantly different. I need to check this more. If it makes sense.
Magnus
31 July 2024 at 1:43 pm #623968ParticipantHi again!
Looking more into this now in daylight. Robin, how do you determine that HD207673 is reddened`? By comparing with an artificial Pickles spectrum? Or with Paolo Berardi’s spreadsheet and functions?
And: how would I find good ref stars to check and validate my process? And for taking good spectra moving forward – let’s say SS Cyg: I found HD207673 through the ReferenceStarFinder_V3 excel file. As I understand it, I would need to check the ref stars more thoroughly. But how? Any advice is warmly welcome.
Magnus
31 July 2024 at 8:52 pm #623988Robin LeadbeaterParticipantHi Magnus,
I am not saying that this is necessarily the problem here but with the technique generally used by amateurs for flux calibration using reference stars nearby in the sky to the target it is important to do some investigations into the stars used as a reference. This is different to photometry where others (eg AAVSO/BAAVSS) have done the hard work and prepared nice sets of reference stars, checking that they are non variable and accurately measuring their brightness. As spectrcoscopists we are not so fortunate so we work with what we can find . A rule of thumb for example is to use main sequence stars as giants are more likely to be variable. Also look to see how they are described in SIMBAD and if they appear as variables in AAVSO VSX.
HD207673 raised a number of red flags for me. SIMBAD defines it as A2ib a hypergiant star so likely to be variable. Its MILES spectrum does not look like it should for the given spectral classification possibly due to reddening, even though the data in the spreadsheet suggests E(B-V) =0. This is likely to be wrong as the SIMBAD data suggests E(B-V) = 0.4 which would confirm some reddening. Perhaps the MILES spectrum is ok, perhaps not.
Professionals take a different approach, using a small set of reliable standards which might be far from the target at a different air mass and correcting for the atmospheric extinction separately. Christian Buil advocates this method for his StarEx/SpecInti project and it might work for you. If it does it is perhaps a better method but it does not work for me as my atmospheric conditions are not stable enough and my telescope has achromatic lenses (a focal reducer) so the instrument response is not constant but highly dependent on the focus on the night.
If you were getting good results with your previous camera but not now and suspect this is a new problem perhaps the best thing to do is to try to reproduce some of your previous measurements using the same stars. This would then narrow the area down that you need to investigate.
Cheers
Robin1 August 2024 at 3:00 pm #624015Robin LeadbeaterParticipantMagnus said
“So it might be that the different profiles are captured at times when the skyglow was significantly different. I need to check this more. If it makes sense.”
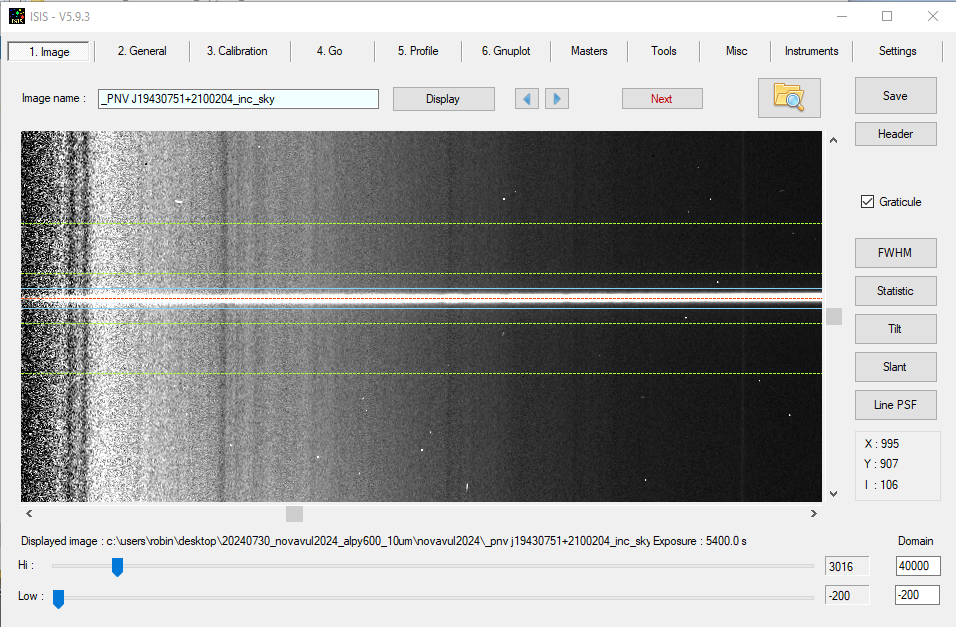
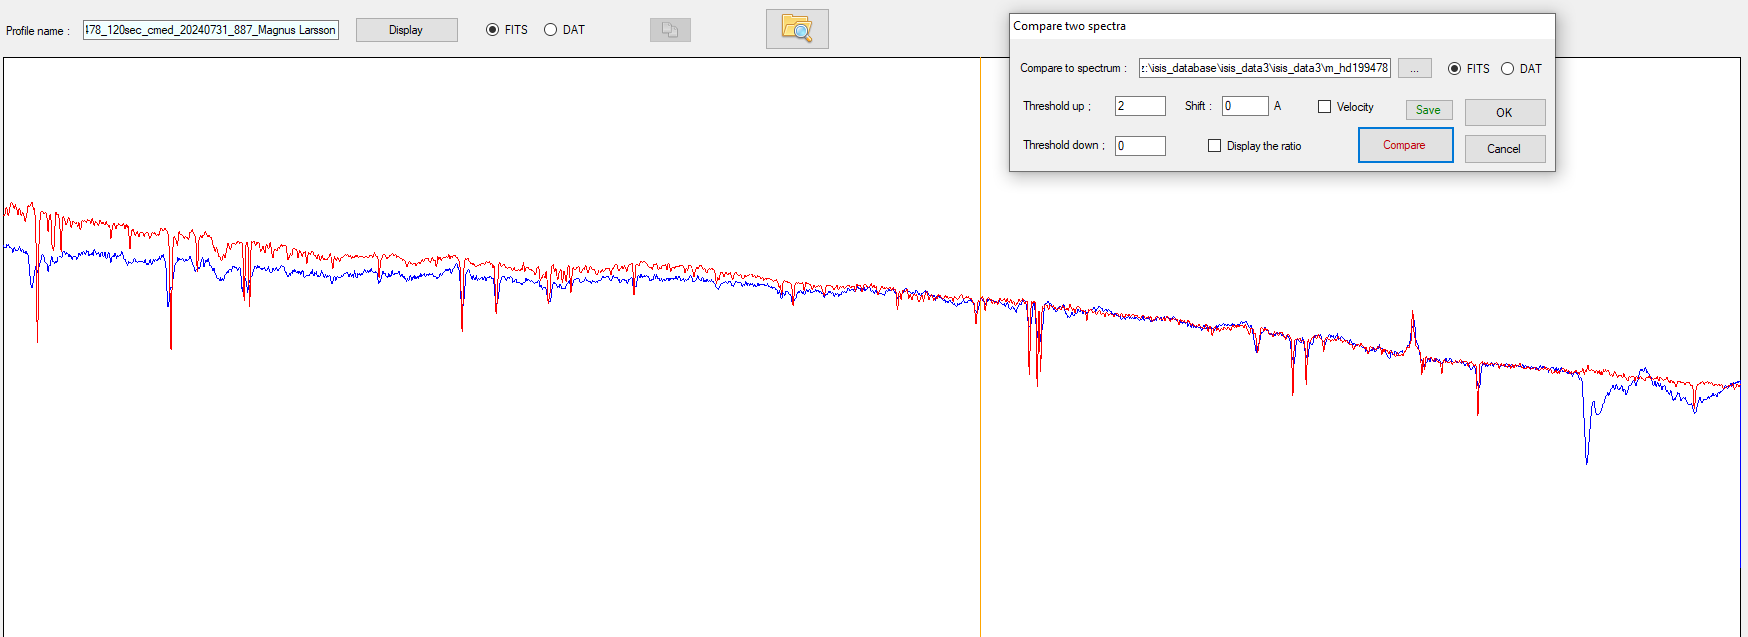
Yes accurate sky background subtraction is important particularly at this time of year for me too as any remaining offset will change the resulting response curve It will work ok on the original reference star but then give to wrong result on other stars due to the difference in background offset relative to the brightness of the target. Chose the spectrum binning zone so it includes the full width of the spectrum and the sky zones so they are close to the spectrum but do not include any of the spectrum. Stretch the image to see this better eg here Nova Vul 2024 in twilight
Attachments:
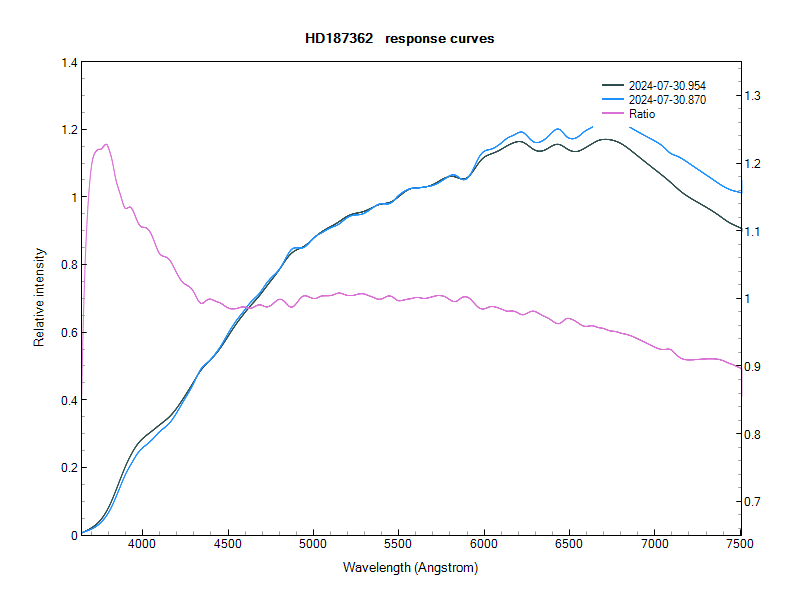
1 August 2024 at 3:11 pm #624019Robin LeadbeaterParticipantOne thing I like to do if possible is to take references before and after the target, particularly when the exposure time is long. For the nova Vul 2024 spectrum I used HD187362 an A1v-A3v star depending on which reference you take and with B-V = 0.07 so matching the expected colour for that spectral class. I used it with the Pickles A2v spectrum. The response changed a bit between the two measurements 2 hours apart, partly due to the decreasing air mass but mainly I suspect due to a drift in focus as I took it early in the evening and everything was still cooling down. I used the average response and the end result should still be within my normal claimed precision of +-10% 4000-7500A
Cheers
Robin-
This reply was modified 1 year, 11 months ago by Robin Leadbeater.
Attachments:
1 August 2024 at 5:23 pm #624022ParticipantHi!
Thanks, Robin, that is a very good idea.
I’ve been experimenting as much as I can, trying to make sense of this. Last night, I captured spectra of 4 stars w Miles spectra – I found them via ReferenceStarFinder and checked in the Paolo Berardi excel-file and in VSX. It looks like it is a bit hard to find a good ref-star close to SS Cyg – or …? 🙂 Stars are:
HD169027: this was the only one of the 4 that was NOT in VSX, not identified as variable. It is in Dra, and a little bit of distance from SS Cyg – however, at similar altitude last night when I captured them.
HD198478: Blue giant, slightly variable
HD199878: similar, blue giant, slightly variable
HD207330: spectroscopic binary.
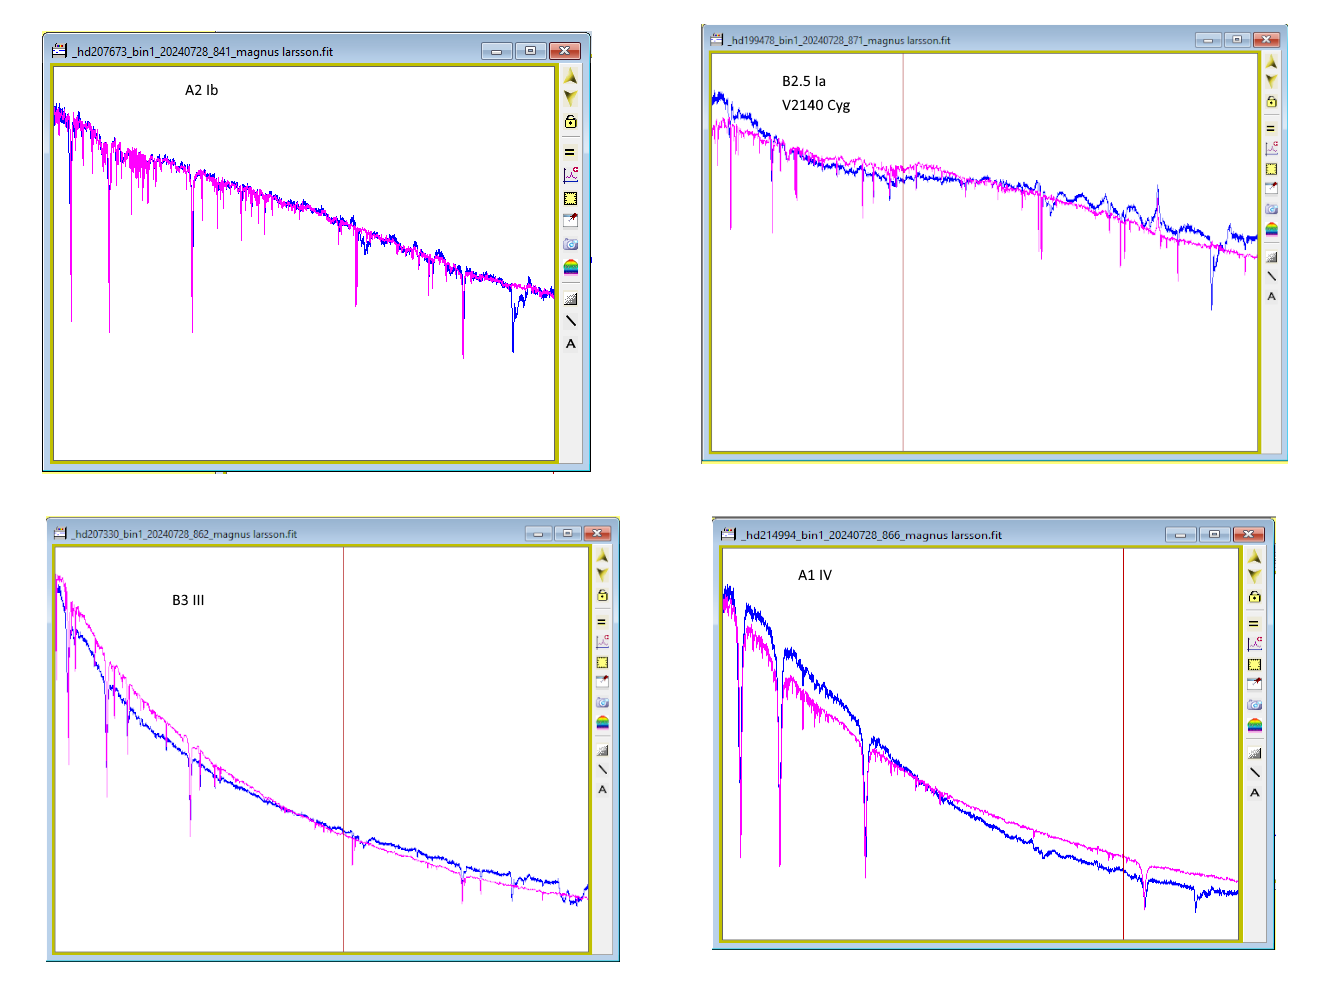
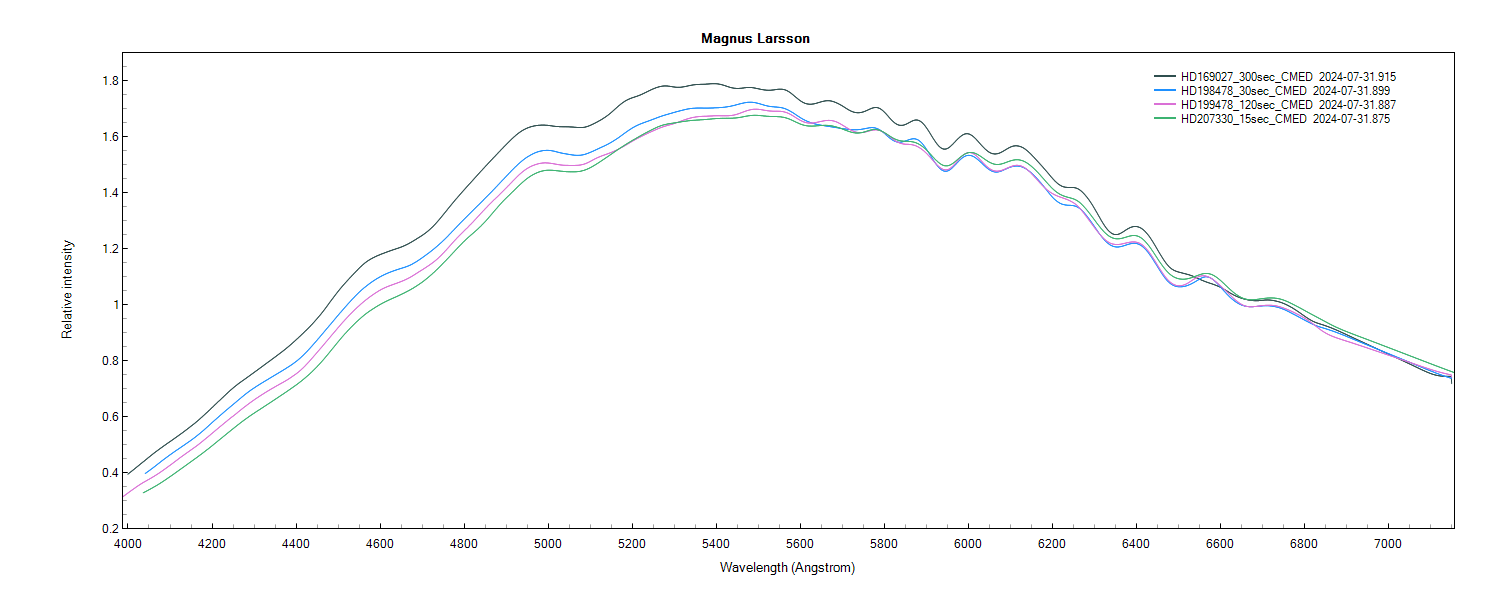
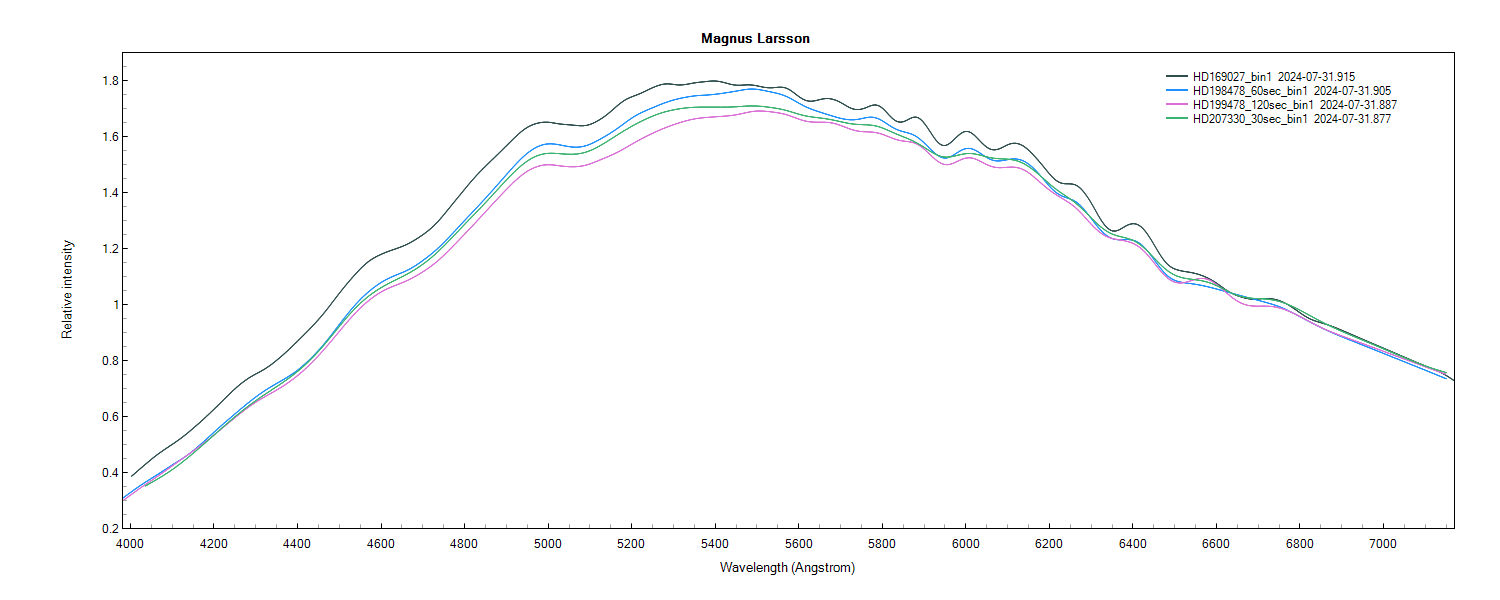
The last three are close in Cygnus.I then tried producing response profiles from all and cross-process them. I did the whole process both with bin 1×1 (raw) files and no flat, and with the CMED process, so they are bin 2×2 and there is a flat involved. Interestingly, these two ways produce somewhat different results.
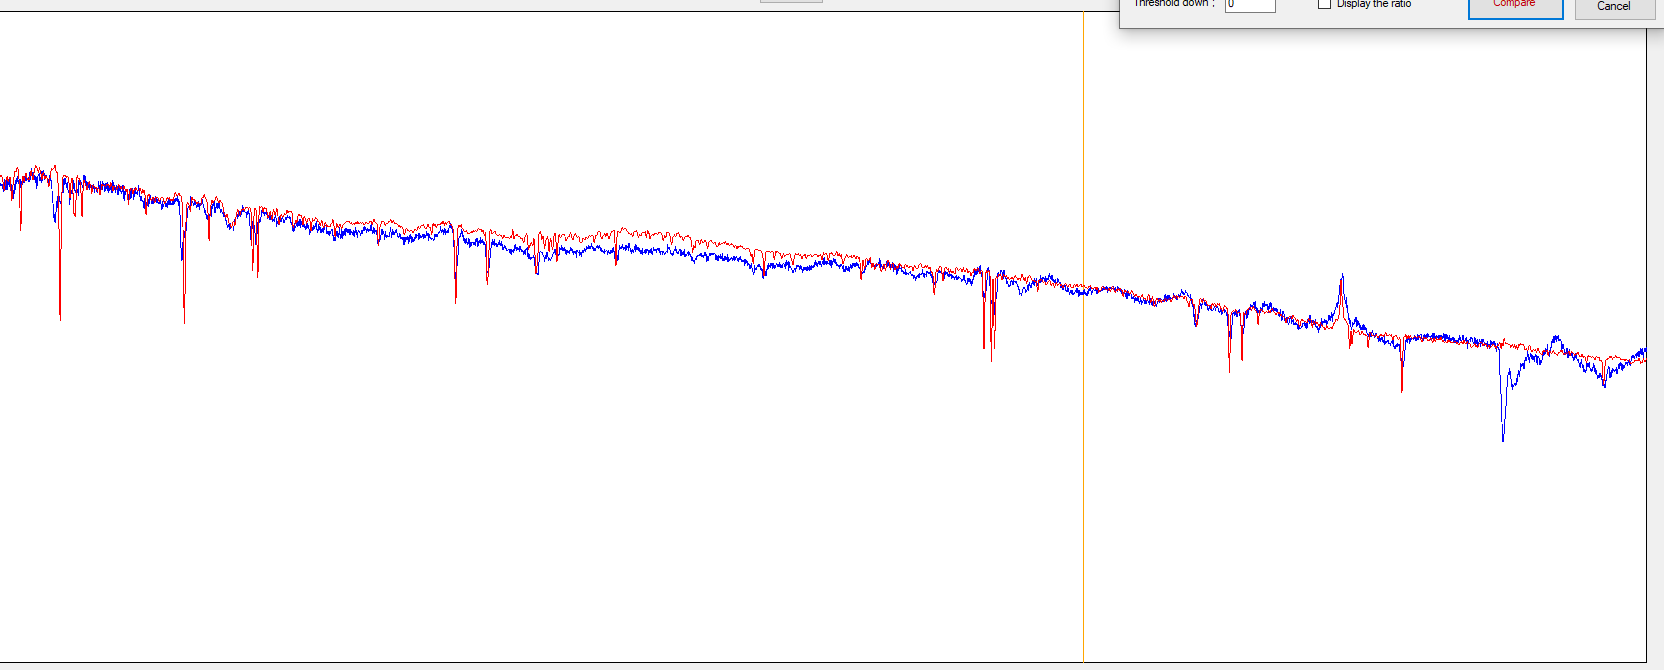
Attached are two comparisons betwen the 4 reference profiles, one with profiles produced in bin1x1-noflat-mode, the other in bin2x2-withflat-mode. Interestingly, there is significantly more difference between them in the bin2x2-withflat-mode! Moreover, in both, HD169027 stands out. Possibly the distance leads to different profile….?
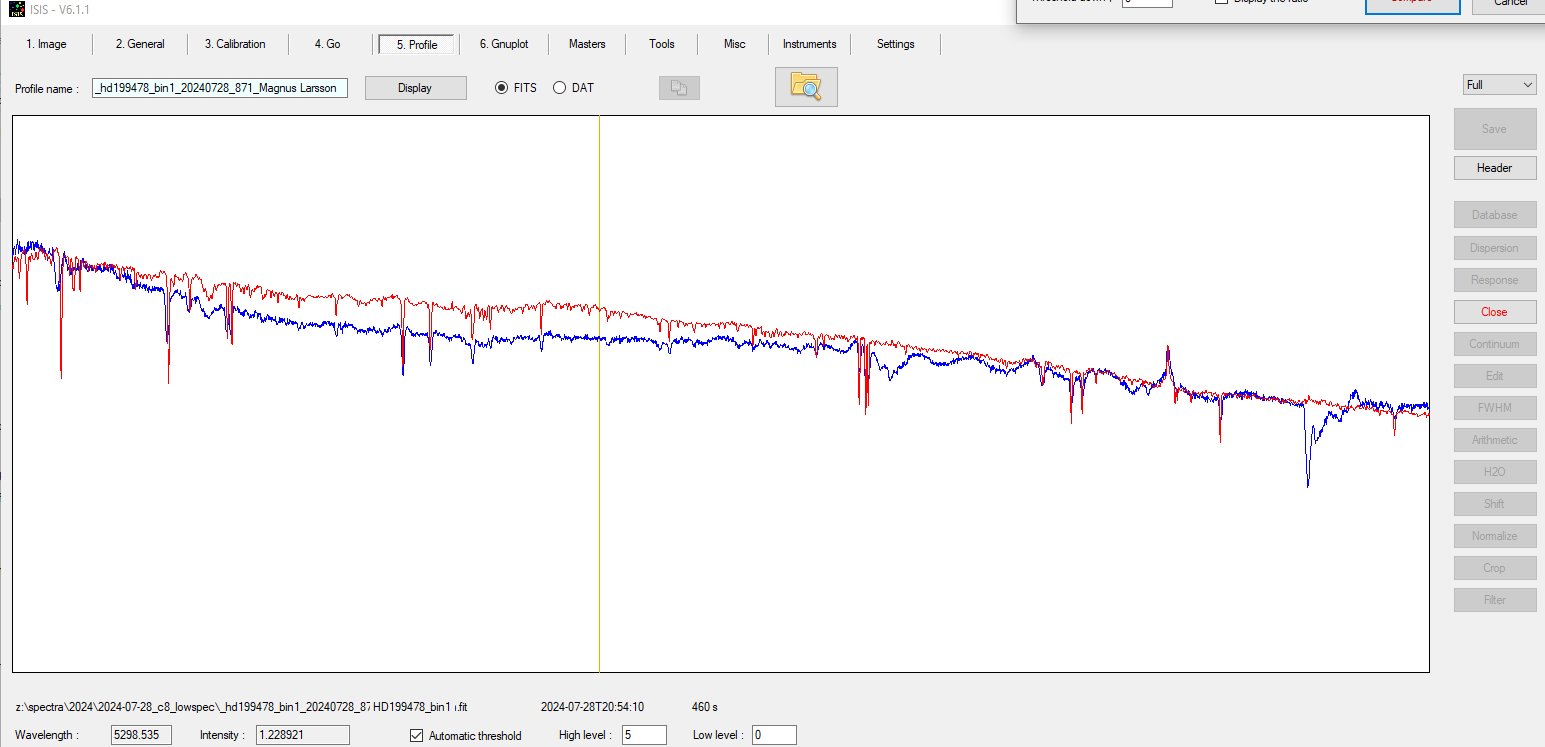
Processing the stars: I can get good alignment between the two giants – see attached screenshot. Again, clearly better in bin1x1-noflat mode.
So, how can I make sense of this? Is it my flat with very weak signal in the blue (I use a halogen lamp) that plays games with me? Am I doing something wrong? I must admit that this is quite frustrating…. Any ideas very welcome. And I’d be happy to share any of these files….
Magnus
-
This reply was modified 1 year, 11 months ago by
1 August 2024 at 6:50 pm #624028ParticipantHi again!
Robin, regarding the binning and skyglow: I’ve been a bit worried about the width of the bin I am using. I see you set a bin on your image there that I would call quite generous. I was afraid that if I allow too much of the skyglow in, so to speak, it would possibly taint the result. On the other hand, I risk losing some photons… With inspiration from the screenshot you share here, maybe I should not worry so much about a too wide bin zone, trusting that ISIS can handle it? And actually, in the resulting images I get, the sky is fairly black within the sky zones…
Magnus
1 August 2024 at 7:42 pm #624029ParticipantHi again again 🙂
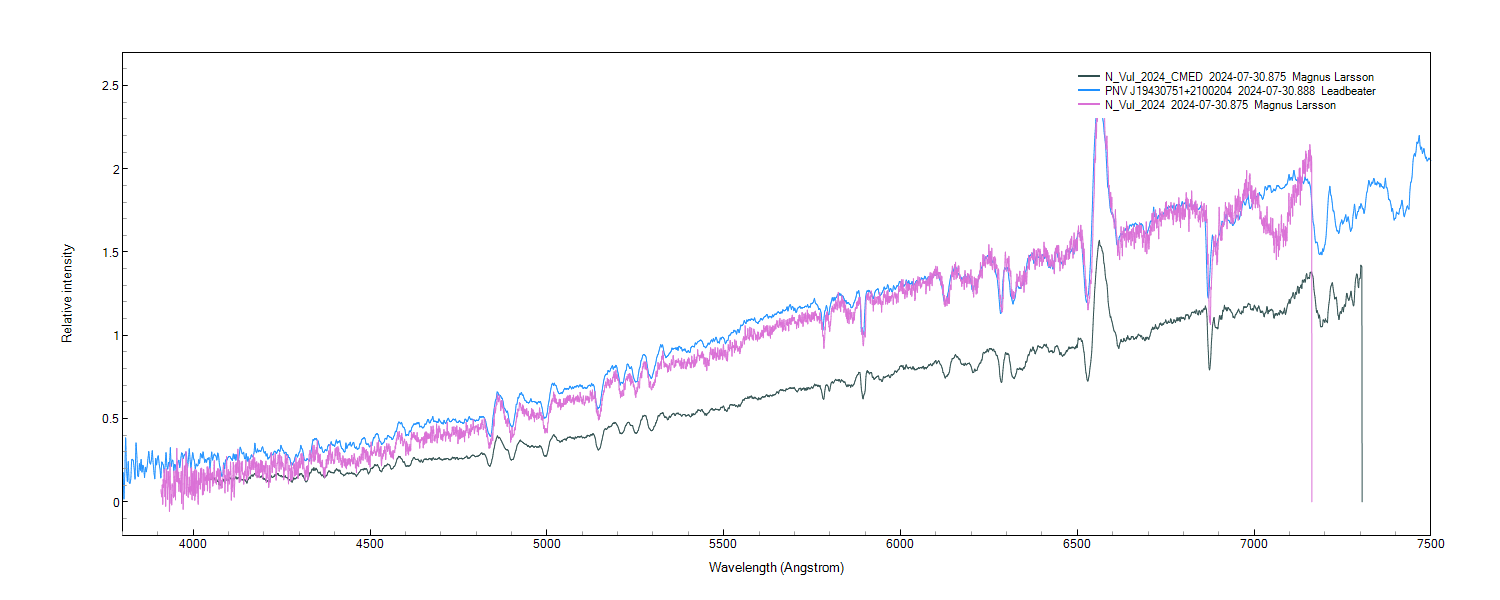
Just for fun, I compared my N Vul spectrum to your, Robin. It was not a good match. Then I remade the processing with another flat, with more signal in the blue. And now, lo and behold, I think it is a qulte nice match. See the attached. The lower green is my previous version, the nice one is yours and the more noisy is my new one.
Might we call that progress?
Magnus
Attachments:
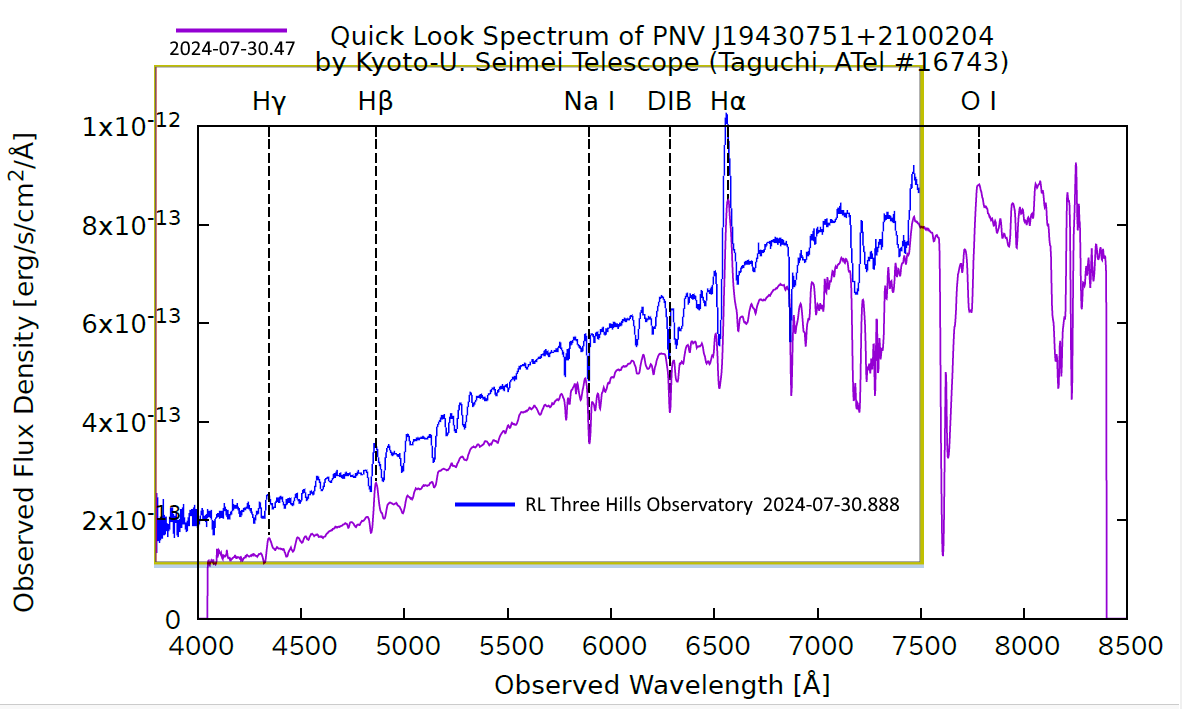
2 August 2024 at 1:12 am #624035Robin LeadbeaterParticipantLooks good. My continuum is also a good match against the classifying spectrum from ATel 16743 taken a few hours earlier, here overalaid, displaced in y for clarity
-
This reply was modified 1 year, 11 months ago by Robin Leadbeater.
Attachments:
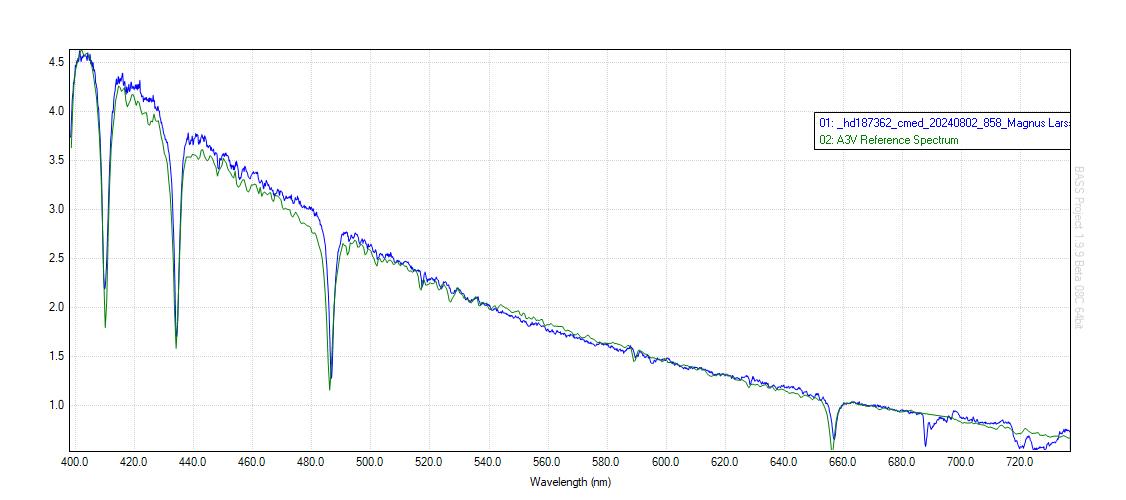
3 August 2024 at 9:16 am #624046ParticipantHi again!
So, some new developments here: I’ve been producing new flats and playing around. Last night I used HD185859 as ref star, produced a resonse profile. Then I captured a spectrum of the star you used, Robin, HD183762 with the same response profile. As far as I can see, that one is not in the Miles library. But I compared it to a Pickles spectrum (in Bass). See the attached file. Is this to be considered OK?
Magnus
Attachments:
3 August 2024 at 11:26 am #624049Robin LeadbeaterParticipantExcellent ! The matching width and strength of the Balmer lines in your HD187362 spectrum with the Pickles reference confirms the spectral classification (I used A2v but the difference between A2v and A3v is <5%, perhaps A2.5V would be the closest match) and the matching continuum shape tells us that there is little or no interstellar extinction. We can now also confidently use HD187362 as a reference star
-
This reply was modified 1 year, 11 months ago by Robin Leadbeater.
-
This reply was modified 1 year, 11 months ago by Robin Leadbeater. Reason: added more info on spectral classification
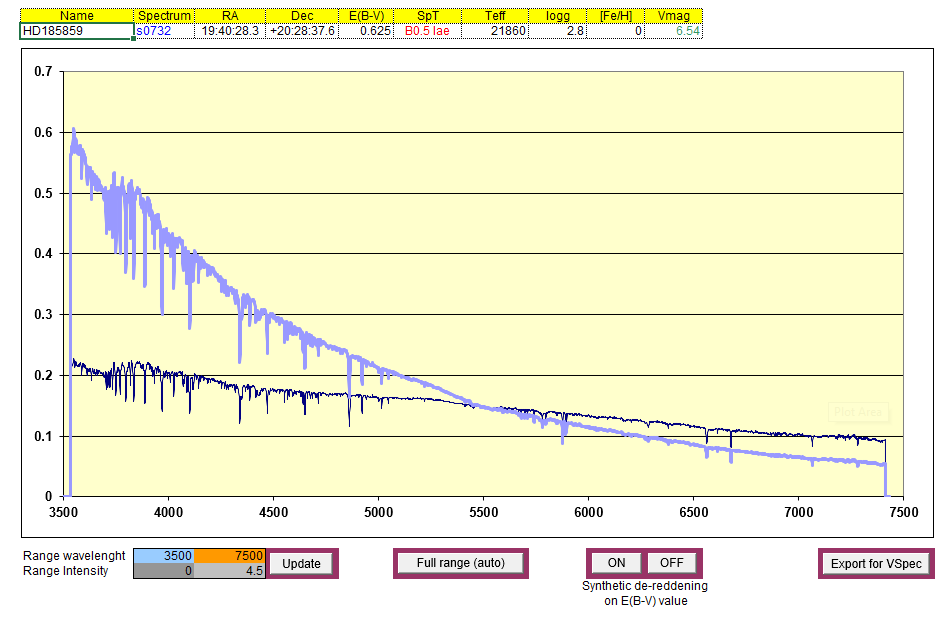
3 August 2024 at 1:44 pm #624055Robin LeadbeaterParticipantPerhaps more significantly though is that in this case it confirms that the MILES spectrum of HD185859 appears to be ok, despite it being a blue hypergiant emission line star (B0.5 Iae) with a very high IS extinction of E(B-V) = 0.6 (I have to say it would not have been my first choice as a reference star !)
-
This reply was modified 1 year, 11 months ago by Robin Leadbeater.
Attachments:
3 August 2024 at 2:22 pm #624059ParticipantHi!
Great, I was quite curious about the quality of that star as well. Or maybe expressed more generally: why and how does reddening matter? OK, the actual spectrum does not match what we would expect – but as long as it is consistent as it is, could that not sufficient for a good ref-star? Just want to understand your reasoning there.
Moreover: I guess it would now also be possible to conclude (at least provisionally) that my problems with responseprofiles was related to the quality of the flat. My thinking in some detail: I use a camera with relatively low dynamic range (8 bits). This makes it challenging to capture the spectrum of a halogen lamp with color tempereature of about 2900 K so that I both get sufficient data in the blue end and avoid saturation in the most intense parts. I solved this now by turning the gain down to 0 (zero), getting maximum dyanmic range (I use a gain of 200 for capturing the faint stars like N Vul 2024 or SS Cyg at quiescence). With that setting, I get around 1400 counts in the lowest end. Previously, with higher gains, I had a count of 3-400. I suppose such low levels cause problems after dark reduction, since I am left with a very low count, very sensitive to low variations in the target spectrum (since I am dividing the target with the very faint flat). Makes sense?
SO I have learned a lot about flat production with these cameras (I have the ASI183mm), I think. Beyond learning more about how I need to check my intended ref-stars.
Magnus
3 August 2024 at 3:50 pm #624060Robin LeadbeaterParticipant” why and how does reddening matter? OK, the actual spectrum does not match what we would expect – but as long as it is consistent as it is, could that not sufficient for a good ref-star? ”
If the spectrum is reliable then yes, reddening should not matter as you have shown here. 0.6 reddening is a lot though (~80% of the light in the V band is being absorbed) and I prefer my reference stars to be as “normal” as possible. If the (B-V) matches that expected for the spectral class as it should do for a star without IS extinction that gives added confidence that all is well. (Reddening of course matters and needs to be low if we are assuming a spectral type and using the Pickles spectrum)
” I use a camera with relatively low dynamic range (8 bits)”
8 bits is not really enough for serious work but are you sure your camera is only 8 bits? the ASI183MM spec says it can run at 12 bits (often stretched to appear as 16 bits in fits images by the software.)
https://www.zwoastro.com/product/asi183/I don’t have much experience of CMOS cameras but as a starting point I would suggest setting the gain so you use the full 15k well depth, expose so the maximum is around 2/3 of saturation and average many flats (eg 20-30) to beat down the noise at the blue end, not forgetting to subtract bias and dark when [preparing the master flat (The ISIS “masters” tab handles this)
The other thing to watch out with flats is stray light in the spectrograph. I don’t know what the LowSpec is like but with the LHIRES, flats at the blue end are unusable as most of the light comes from stray light, not from the spectrum !
-
This reply was modified 1 year, 11 months ago by Robin Leadbeater.
-
This reply was modified 1 year, 11 months ago by Robin Leadbeater.
-
This topic was modified 1 year, 11 months ago by
-
AuthorPosts
- You must be logged in to reply to this topic.