Characterising strong outbursts vs. weak outbursts of 29P / Seasonal changes
<= Back to MISSION 29P Homepage
MISSION 29P has now completed some 11.3 year’s coverage in which we have tried to monitor the comet as frequently as possible, often measuring its brightness several times per day. As of 2025 August, we have detected at least 268 outbursts of which some 112 events have been strong eruptions defined in terms of the intensity of the outburst coma each eruption produces. This is expressed in terms of units of ‘nucleus equivalents’ or n.-e. If a new outburst coma reflects the same amount of light as the nucleus alone then its intensity is 1.00 n.-e. We adopt the convention that ‘strong’ outbursts exhibit intensities in excess of 4.0 n.-e. The most intense single eruption event detected was on 2021 Sep 27.68±0.06 when the reflective dust equivalent of about 270 times the brightness of the nucleus was ejected into space in a singular short-lived event. The weakest outburst measured using the standard photometric aperture method was 0.19 n.-e. on 2021 Jan 04.03±0.16: that equates to a dynamic range of >1400:1. Using multi-aperture photometry, we can quantify the coma growth curve and this method can detect step changes in brightness of 0.10 n.-e. when imaging with a 2.0-m aperture telescope.
There are various types of analysis that we can undertake with the data and because we have detected such a large number of outbursts virtually all of which complete erupting on a time-scale of <1 h, we can study the results in a statistical fashion. Let’s first see if we can distinguish whether strong outbursts are in some intrinsic way different to weak outbursts. There are several ways we can show this. Here are a couple of plots of the intensity of each outburst versus the time in days since the previous outburst of the same category (strong in red, and weak in blue) that illustrate this. We measure times of outburst fairly accurately: median uncertainty is close to ±0.2 d.
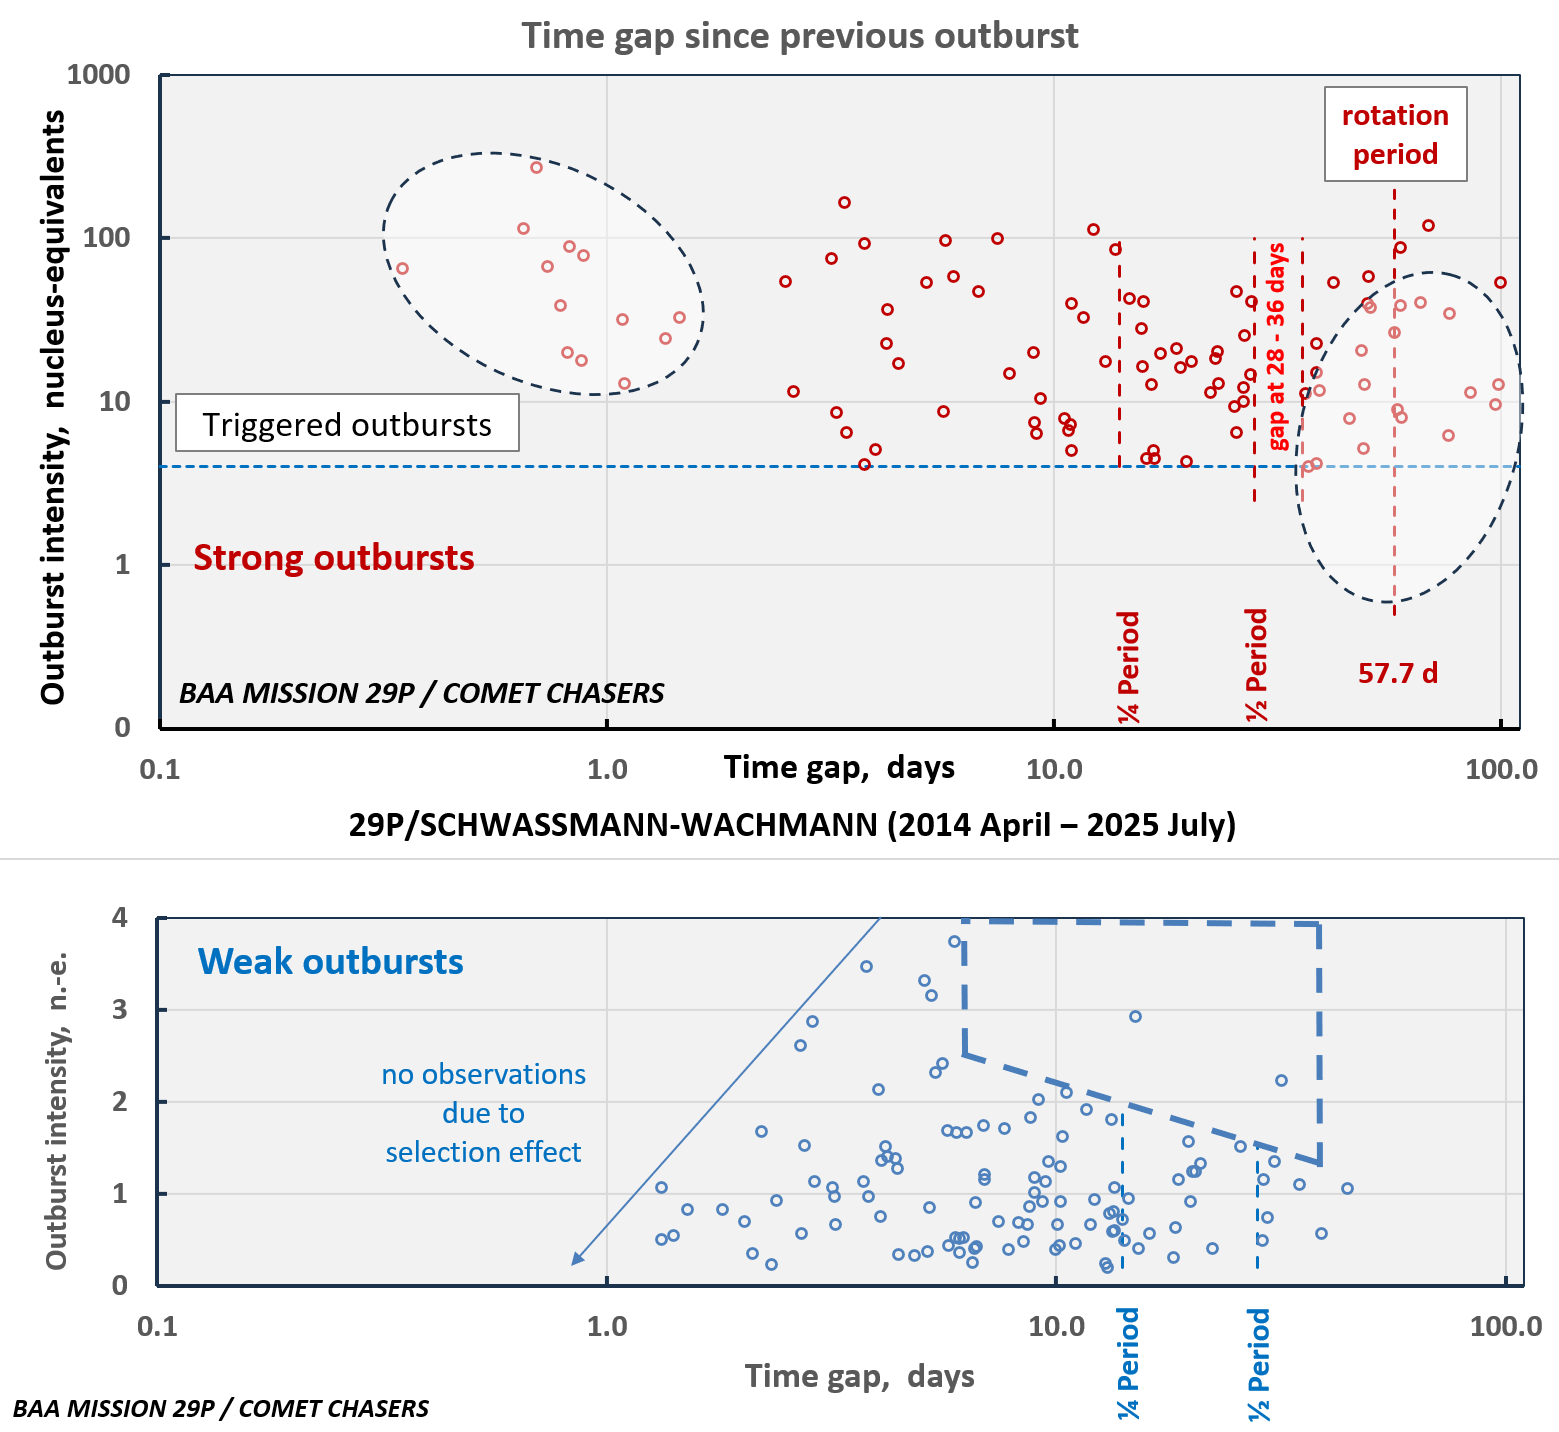
These plots show various features worth remarking on. One really obvious characteristic is that of the ‘triggered’ strong eruptions, in which one strong outburst sets of another strong event within typically 0.5‒1.5 d. Usually it takes a previous strong event with intensities of >20 n.-e. to trigger a subsequent one, which may be interpreted as debris falling back onto the nucleus and causing a fissure in the consolidated crust under which a significant pressure has built up in cryomagma chambers.
A significant fraction of strong outbursts are grouped around the nominal rotation period of the nucleus, viz. 57.7 d. This shows that a day-night cycle facilitates strong eruptions but are unrelated to weak outbursts virtually all of which take place within < one-half rotation of the nucleus. This suggests there are many more sources of weak outbursts than strong ones.
An interesting category are those consecutive outbursts that are separated in time by between ¼ and ½ of a nucleus rotation as these appear to be bimodal in intensity. The weak outbursts are particularly weak at a median intensity of just less than 1 n.-e. whereas another set of strong outbursts exhibit a median intensity of about 15 n.-e. with a small fraction of outbursts in the range of 2 to 8 n.-e.
Seasonal changes also show times in the orbital year when strong and weak events also become bimodal in intensity distribution. Here’s a logarithmic plot of Intensity vs. Julian Date:
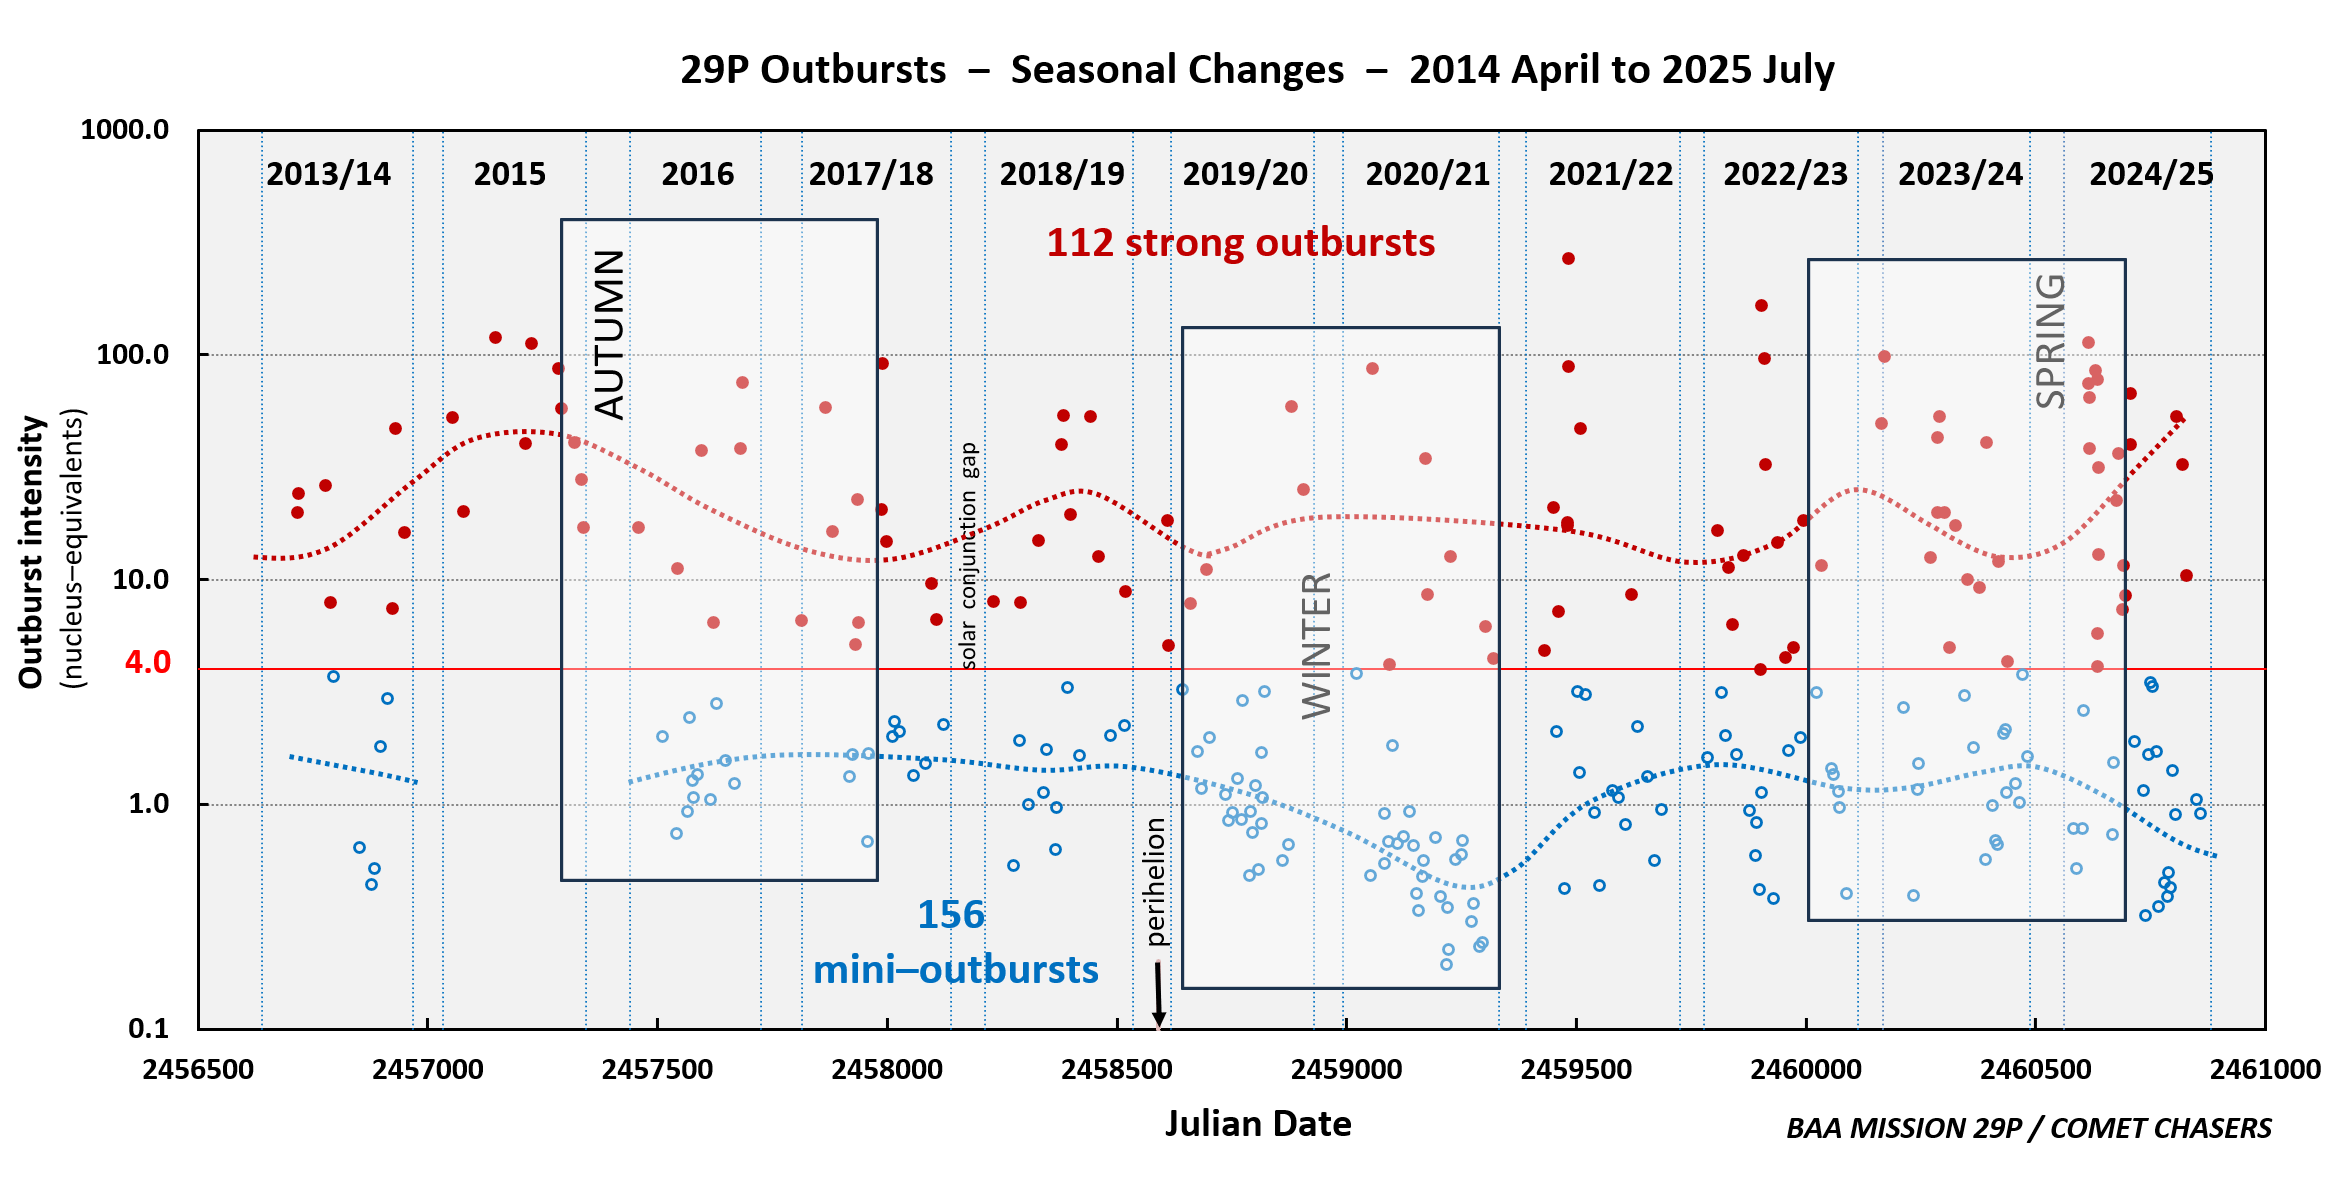
The plot is labelled showing a presumed WINTER (meaning Winter Solstice period for one hemisphere) along with the previous AUTUMN (Equinox) and the following SPRING (equinox) to illustrate how the strong and weak events are differentiated in a chronological sense. This latest apparition has involved many very strong events, several of which have been the results of triggering by the previous eruption. The red and blue dashed lines are an attempt to show the bimodality. The 2020/21 and 2024/25 apparitions are very different. The former seem to show that weak and strong outbursts are intrinsically different. In 2020/21 the intensities were virtually all <1 nucleus-equivalent, whereas this latest apparition has 16 eruptions of >10 n.-e. compared to just 3 events in 2020/21.
A working hypothesis that we are using to explain the difference between weak and strong events has a parallel in terrestrial volcanicity in which one category (equivalent to weak outbursts of 29P) involves effusive events such as the eruptions on Mauna Kea or Iceland involve magma exuding through fissures in the crust and flowing away from the site, or ejecting a fountain of lava under pressure. Here the magma has very little gas (H2O or CO2) dissolved in it partly because it is not held under a very large pressure, it being near to the surface in these locations. The other category is the explosive eruption where a plug of material sometimes several km in depth holds the magma under great pressure and this results in volatiles, especially H2O, dissolving in the molten magma at high concentration. If the plug is dislodged quickly then the sudden pressure drop causes the H2O to be released from the magma in an explosive fashion. The cryomagma analogy has as the extreme volatiles, CO, N2 and O2, and under pressures of 10-100 kPa can dissolve at high mixing ratios in a hydrocarbon medium especially linear molecules such as methane , ethane and propane, the mixture forming a very low melting point eutectic at <50 K. Of course the low gravity (escape velocity of _25 m/s) and absence of an atmosphere means that a large fraction of most weak outbursts form a continually expanding dust coma but with the slow-moving debris falling back onto the nucleus causing it to gradually be resurfaced over a long time-frame.
| The British Astronomical Association supports amateur astronomers around the UK and the rest of the world. Find out more about the BAA or join us. |