› Forums › General Discussion › map of light pollution trends › Reply To: map of light pollution trends
The light pollution map is a worldwide one but we each have our own parochial area that we worry about. Mine is Brisbane Australia where I live. The population is now 2 million.
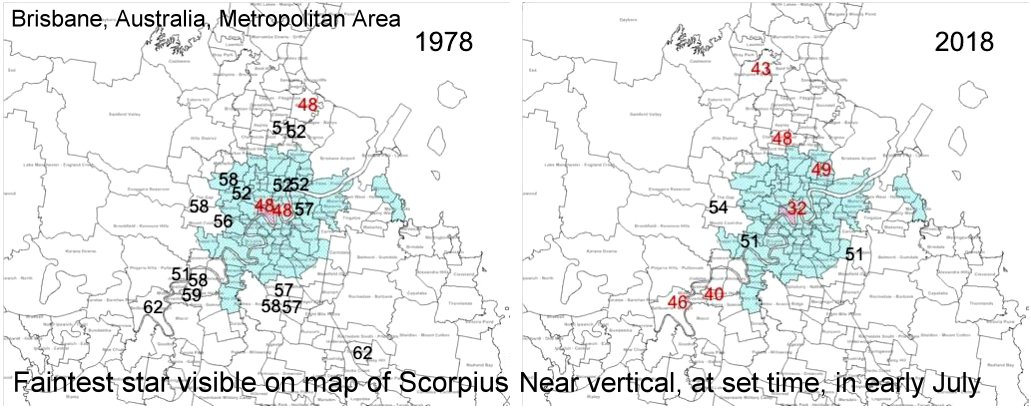
In 1978 when I arranged the first light pollution survey I decided to plan it carefully. The idea was to conduct the research over a short period of time in the mid evening between a short range of dates in the dark of the Moon and distribute charts of Scorpius marked with stellar magnitudes. Scorpius, easily recognisable, was near overhead at the time in July and so the problem of a bright horizon in one direction or the other was avoided. Also the zenith was ‘as good as it gets.’ Instructions about dark adaption were provided.
This exercise was conducted by the Astronomical Association of Queensland in 1978 and repeated in 2018. Though the number of participants is limited, the deterioration in the intervening years is obvious.
A few points about the attached image. Results below mv 4.0 are shown in red. There were only a few participants who contributed to both surveys, myself being one of them, where my results deteriorated from mv5.8 to mv5.4. Observations from near the centre of the city achieved mv4.8 in 1978, but only mv3,2 forty years later. Now of course, though I have tried to approach this scientifically, the big variable in such surveys remains the variability (acuity) of the eyesight of individual observers, plus the tendency to ‘talk up’ your own pet observing site.