› Forums › Variable Stars › What’s happening to Z Ursae Majoris? › Reply To: What’s happening to Z Ursae Majoris?
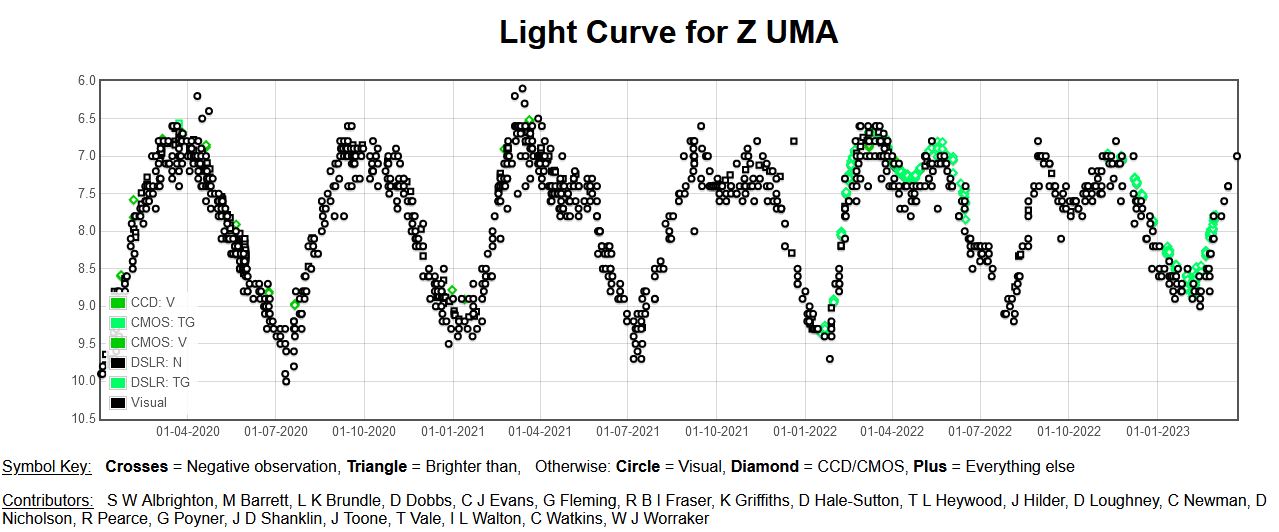
I was pleased to see that Z UMa has been highlighted in a recent facebook post. I have added the light curve of this variable star from this post below. As described, in the last year the maxima have become nicely double peaked and it has been suggested that this is due to the interaction of the two main periods of pulsation of this star. However, how does this square with the analysis of John Greaves that after 1995 there is little evidence for two pulsation periods in the data (see my earlier posts on this topic)?
I wondered if the timescales for the evolution of the double peak fit in with the two periods of 194.0 and 204.8 days that John measured before 1995. If you imagine that the two pulsation periods start out in phase, then after one period of each the peak of the 194.0 day pulsation will be ahead of the 204.8 day pulsation by 204.8 – 194.0 = 10.8 days. After n such periods, the shorter pulsation would be ahead by n x 10.8 days. Looking at the light curve for the star you can see that for the last double peak (September 2022 to November 2022) the two humps were separated by about 3 months or roughly 60 days. This would seem to imply that the two periods would have been in phase n = 60/10.8 ~ 6 periods earlier and this certainly seems feasible looking at the light curve.
So how often would we expect double peaks to be occurring if the two periods of 194.0 and 204.8 days persist? The simple linear addition of two sine curves of the same amplitude but different periods of A and B would result in another sine curve of period 2AB/(A+B) which in this case would be 199.3 days but the amplitude of this would be modulated by a cosine curve of 2AB/(A-B) which is 7,358 days or about 20 years. However, a cosine curve passes through zero twice every period, so the “beat” frequency is half this, i.e. every 10 years. This is only a very rough guide because I am sure that the behaviour is not linear but it seems reasonable given what I said in my earlier posts about how often double peaks occur. Interestingly, the amplitude of the light curve variations does decrease as a double hump approaches.
What is says to me is that we really need more accurate measurements of the light curve to better see what is going on. Have the two pulsation periods begun to die out as John says or are they being hidden in the noise of the data? Perhaps we need regular digital detector monitoring over the next 20 or 30 years to decide this. Anyone fancy this?