› Forums › Variable Stars › What’s happening to Z Ursae Majoris?
Tagged: Z UMa
- This topic has 5 replies, 2 voices, and was last updated 11 months ago by
 Duncan Hale-Sutton.
-
AuthorPosts
-
15 June 2022 at 5:35 pm #611059
 Duncan Hale-SuttonParticipant
I am a new member of the BAA and new to variable star observing. Like many others, I am sure, I have begun a few observations of Z UMa and to find out a bit more about this star I have been doing a bit of reading up. One of the most interesting papers was by John Greaves in the VSS Circular 184 (pdf download). What got my attention was that over the last 50 years or so John has determined that this star’s period of pulsation has been changing. If I have got this right, based on BAA data prior to 1995 there were two contributing pulsation periods – one main one of 194.0 days and one less significant one of 204.8 days. After 1995 the period has settled down to 189.0 days and there is no evidence for the less significant period. What’s more after 2006 the visual magnitude range of variations in this star has increased to about 2.8 magnitudes. John concluded that the period and magnitude range change are making this star more like a Mira variable rather than a semiregular.
So what is causing these changes? What physical changes within the star are causing it to evolve? There is another paper in the literature that I found Secular Evolution in Mira Variable Pulsations which looked at the changes in the period of 547 Mira variables and for about 10 percent of the sample statistically significant long-term period changes were seen. Templeton and Mattei believe that changes could be caused by thermal pulses (which I take it are caused by flashes of nuclear burning in the core?). However, another possible reason that they consider for evolutionary changes in the period is non-linear behaviour in the physics of the pulsation mechanism.
I am interested to know what other people understand about the evolution of these giant stars and whether other semiregular stars are showing signs period change.
17 June 2022 at 10:38 am #611063 Jeremy ShearsParticipant
Changes in periods of Miras is a very active field of research as it might shed further light on stellar evolution in the Asymptotic Giant Branch (AGB) of the HR diagramme. One popular view is that period decrease is due to contraction during the initial stage of the thermal pulse in the helium burning shell, as you indicate.
Another period changer is T UMi. Coincidently there is an MRAS pre-print on ArXiv only today on “Hydrodynamic modelling of pulsation period decrease in the Mira-type variable T UMi” which pursues the matter. It considers hydrodynamic models and non–linear stellar pulsations. The references therein are worth following: https://arxiv.org/abs/2206.08360
Keeping up with ideas and literature in this area could be a fulltime job, but we are lucky to have the monthly AGB Newsletter to help us as it summarises recent literature. You can subscribed to it here: https://www.astro.keele.ac.uk/AGBnews/
The June edition is the 299th, and celebrations are promised for the July edition. It is available here: https://www.astro.keele.ac.uk/AGBnews/issues/AGB299.pdf
The last chapter on this fascinating topic has yet to be written! But it is interesting to note that the research, and the associated models, depend on amateur observations of Miras over many years.
20 June 2022 at 1:26 pm #611094Duncan Hale-SuttonParticipantThanks Jeremy for all these useful links. I have had a brief look at the T UMi paper and scanned the June edition of the AGB Newsletter. People who are modelling the evolution of stars on the AGB seem very keen that we keep monitoring stars whose periods are changing over time.
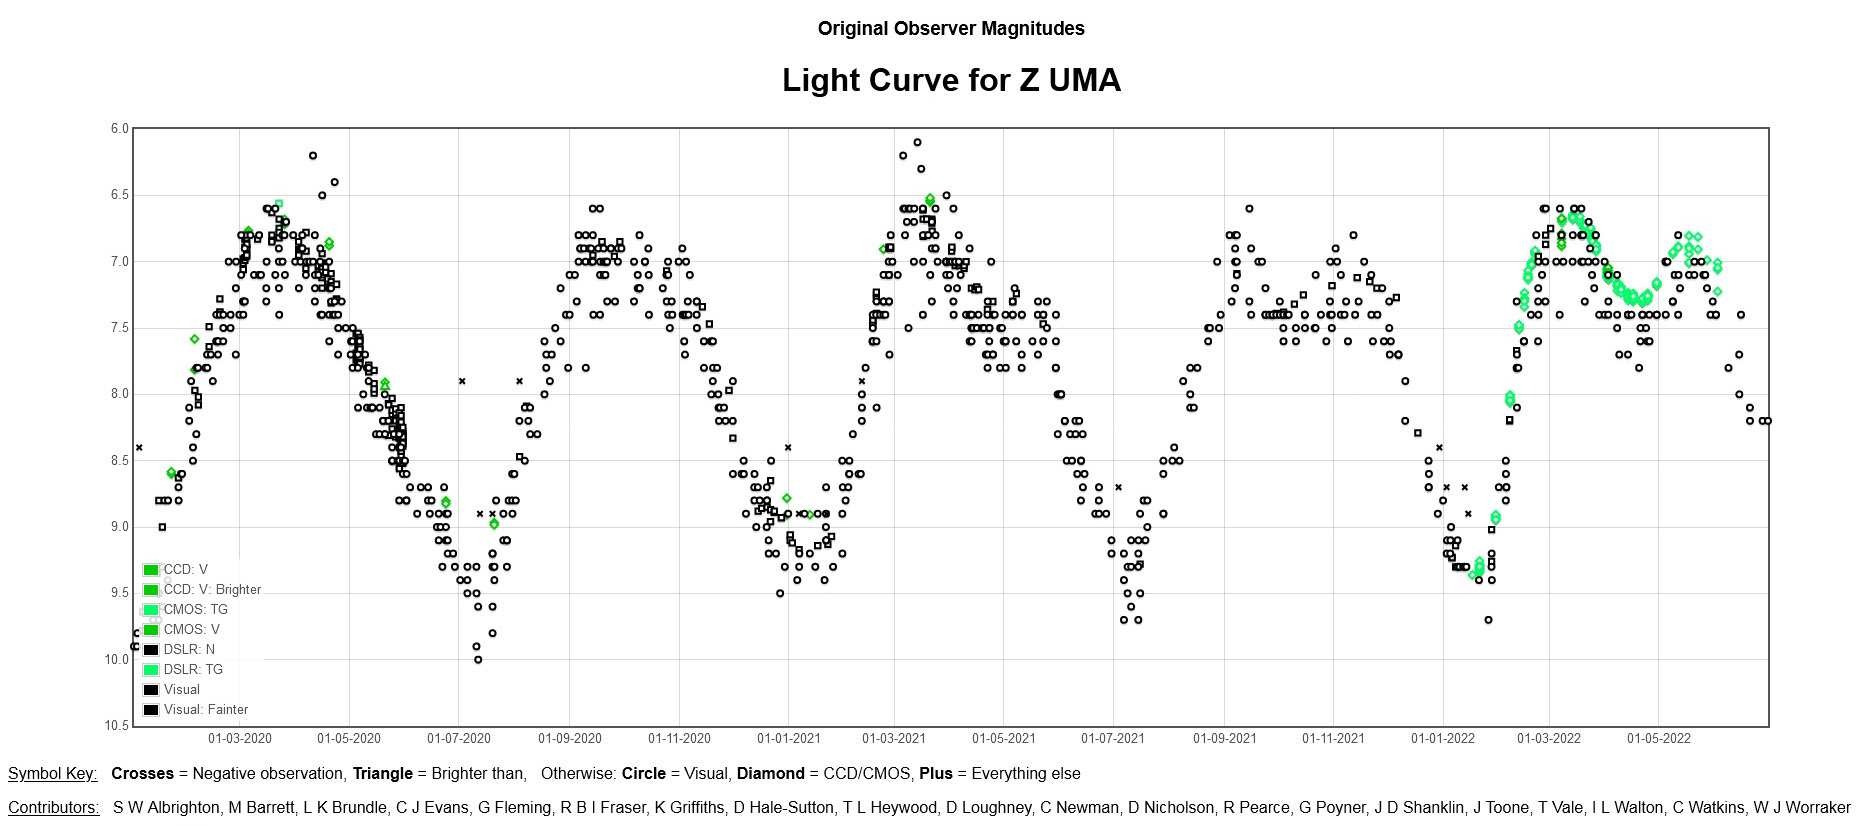
3 July 2022 at 8:25 pm #611242Duncan Hale-SuttonParticipantAnother aspect of the light curve of this star that interested me was that from time-to-time the maxima appear to be double peaked. This has been shown nicely by some recent observations using CMOS detectors (see the attached file which has been produced from the BAA database). If you look at the light curve after the 1st Jan 2022 you can see (green data points) that Z UMa reached a maximum of about magnitude 6.6 around the 14th March, then it faded a bit to about 7.7 around the 21st April before brightening again to about magnitude 6.8 around the 22nd May (roughly 69 days from peak-to-peak). The same double peak is seen in the visual data (black circles) but the scatter in the CMOS data is much tighter. Looking back at the four maxima prior to this the visual data (black circles) hint that this double peaked behaviour has been been developing as time progresses.
If you go back further in time other reasonably clear examples of a double peak can be seen in August 2016, January 2008 to July 2009, January 1999, July 1999 and July 1995 (I haven’t gone back further than this). So what is causing this? One suggestion has been that this is due to the interaction of different pulsation cycles within the star but this is not so easy to understand if, as John Greaves says (see my first post), after 1995 there is virtually only one pulsation period of 189 days. With more people carrying out observations using more accurate electronic detectors it will be interesting to see how often this double peaked behaviour appears.
Attachments:
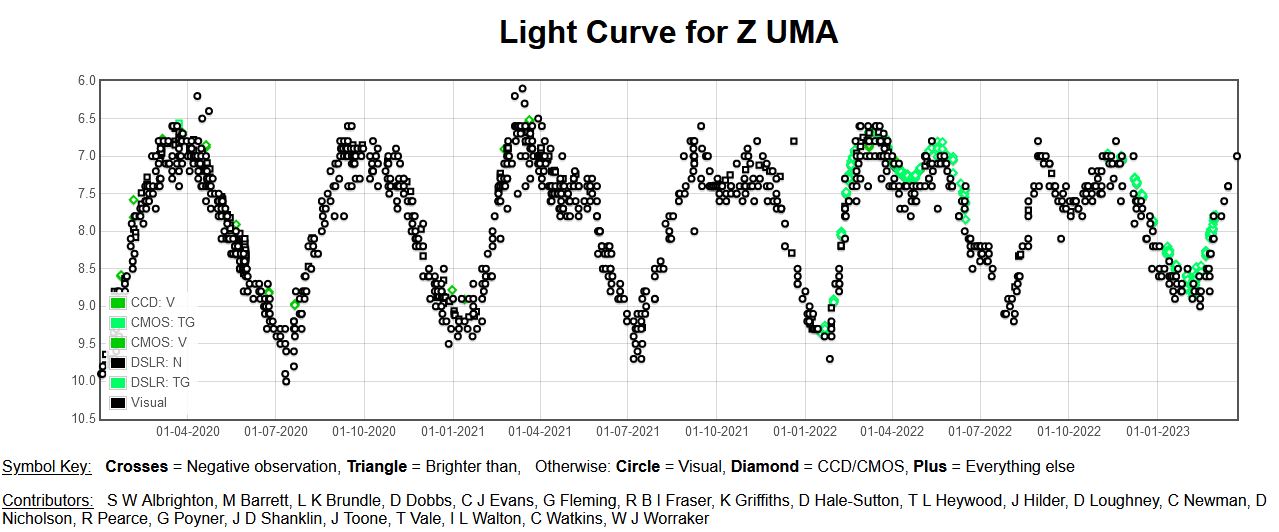
31 March 2023 at 6:58 pm #616462Duncan Hale-SuttonParticipantI was pleased to see that Z UMa has been highlighted in a recent facebook post. I have added the light curve of this variable star from this post below. As described, in the last year the maxima have become nicely double peaked and it has been suggested that this is due to the interaction of the two main periods of pulsation of this star. However, how does this square with the analysis of John Greaves that after 1995 there is little evidence for two pulsation periods in the data (see my earlier posts on this topic)?
I wondered if the timescales for the evolution of the double peak fit in with the two periods of 194.0 and 204.8 days that John measured before 1995. If you imagine that the two pulsation periods start out in phase, then after one period of each the peak of the 194.0 day pulsation will be ahead of the 204.8 day pulsation by 204.8 – 194.0 = 10.8 days. After n such periods, the shorter pulsation would be ahead by n x 10.8 days. Looking at the light curve for the star you can see that for the last double peak (September 2022 to November 2022) the two humps were separated by about 3 months or roughly 60 days. This would seem to imply that the two periods would have been in phase n = 60/10.8 ~ 6 periods earlier and this certainly seems feasible looking at the light curve.
So how often would we expect double peaks to be occurring if the two periods of 194.0 and 204.8 days persist? The simple linear addition of two sine curves of the same amplitude but different periods of A and B would result in another sine curve of period 2AB/(A+B) which in this case would be 199.3 days but the amplitude of this would be modulated by a cosine curve of 2AB/(A-B) which is 7,358 days or about 20 years. However, a cosine curve passes through zero twice every period, so the “beat” frequency is half this, i.e. every 10 years. This is only a very rough guide because I am sure that the behaviour is not linear but it seems reasonable given what I said in my earlier posts about how often double peaks occur. Interestingly, the amplitude of the light curve variations does decrease as a double hump approaches.
What is says to me is that we really need more accurate measurements of the light curve to better see what is going on. Have the two pulsation periods begun to die out as John says or are they being hidden in the noise of the data? Perhaps we need regular digital detector monitoring over the next 20 or 30 years to decide this. Anyone fancy this?
Attachments:
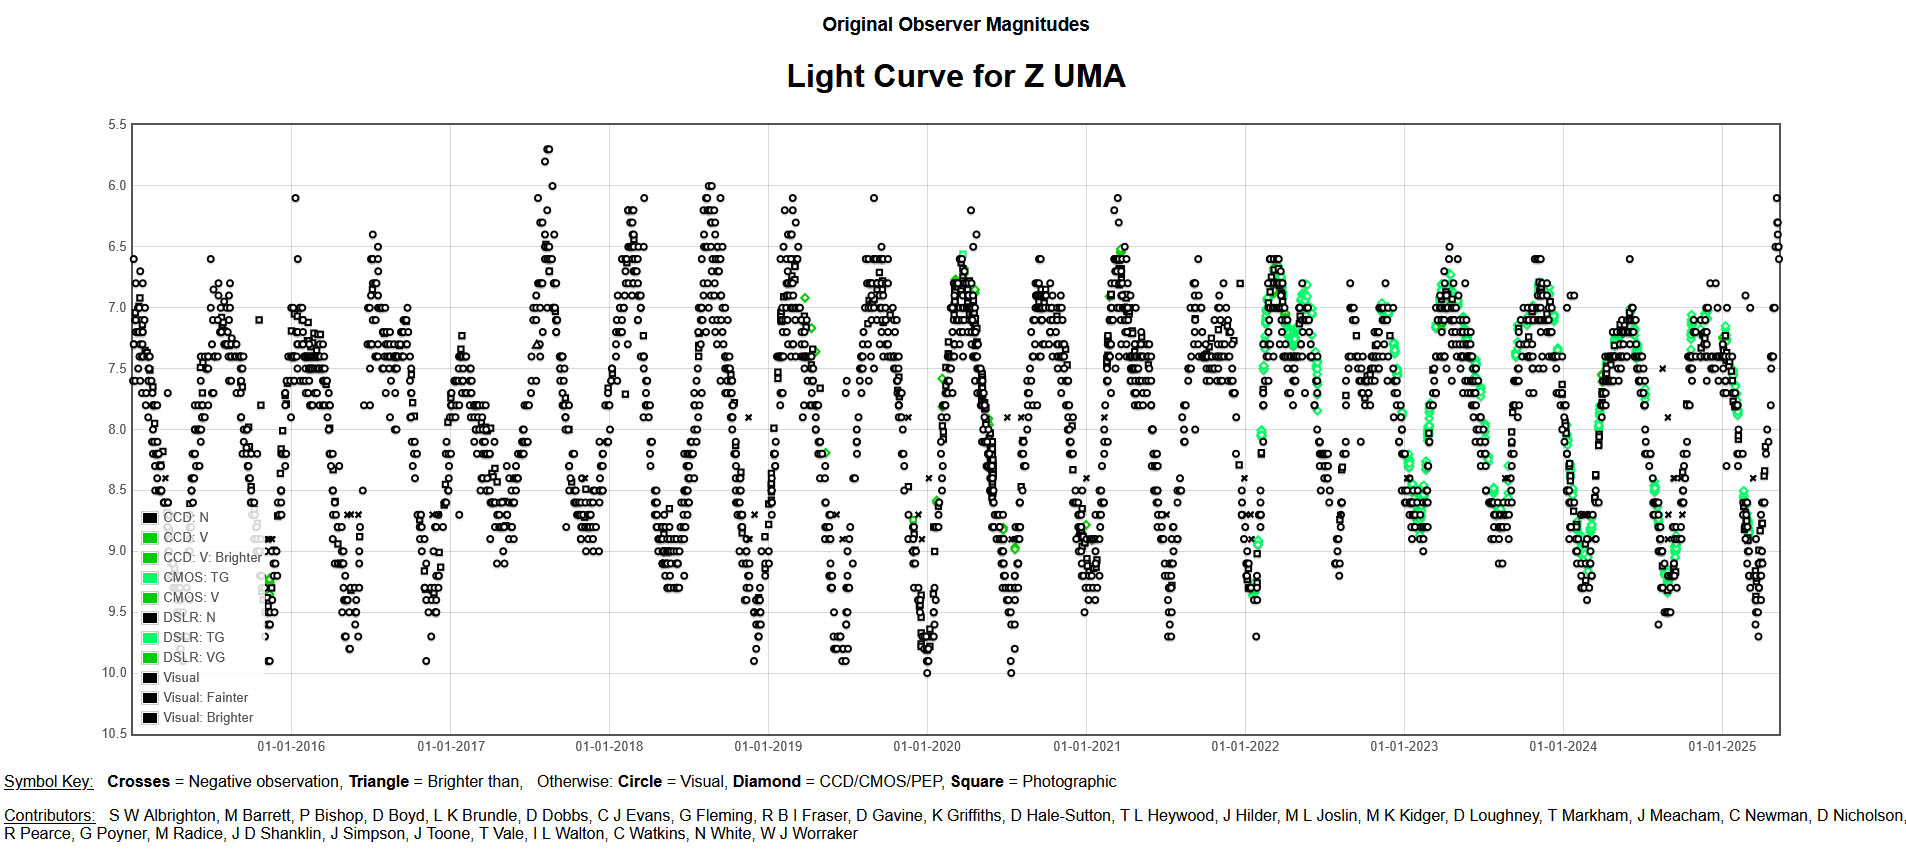
11 May 2025 at 8:13 pm #629852Duncan Hale-SuttonParticipantYou might have noticed that Z UMa has just recently reached a peak in its brightness and this peak was brighter than previous peaks for the last four years (see the attached screen shot from the BAAVSS database). I am going to stick my neck out here and make a bit of a prediction! I think we will see more of this in the next four years with more sharply defined peaks and troughs and a wider range in magnitudes. My reasoning is the interplay between the two periods of pulsation that this star shows. If you look back to 2016-2017 there was a period then when the amplitude of variation died away somewhat and there was evidence for double peaks in the pulsation prior to this. Then the variation recovered and there were more sharply defined peaks and troughs. I think we are now seeing a repeat of this behaviour.
Why do I think this? Well, I am not sure I believe that the second, less prominent, pulsation period in this star is dying away. I think that this modulation of the amplitude and the double peaks (see above) is evidence that the two pulsation periods in this star are still operating together and causing the modulations to the primary pulsation period that we see. Over the next four years we will probably see these sharply defined peaks because the two periods are acting in concert and then after this they will go out of phase and we will see the return of the double peaks and the lower amplitude range. We shall see! For more on this read my previous posts on this subject.
Attachments:
-
AuthorPosts
- You must be logged in to reply to this topic.