- This topic has 40 replies, 10 voices, and was last updated 1 year, 12 months ago by
Peter Lyon.
-
AuthorPosts
-
2 July 2024 at 6:54 am #623602
Mr Giovanni Di Giovanni
ParticipantGood morning everyone
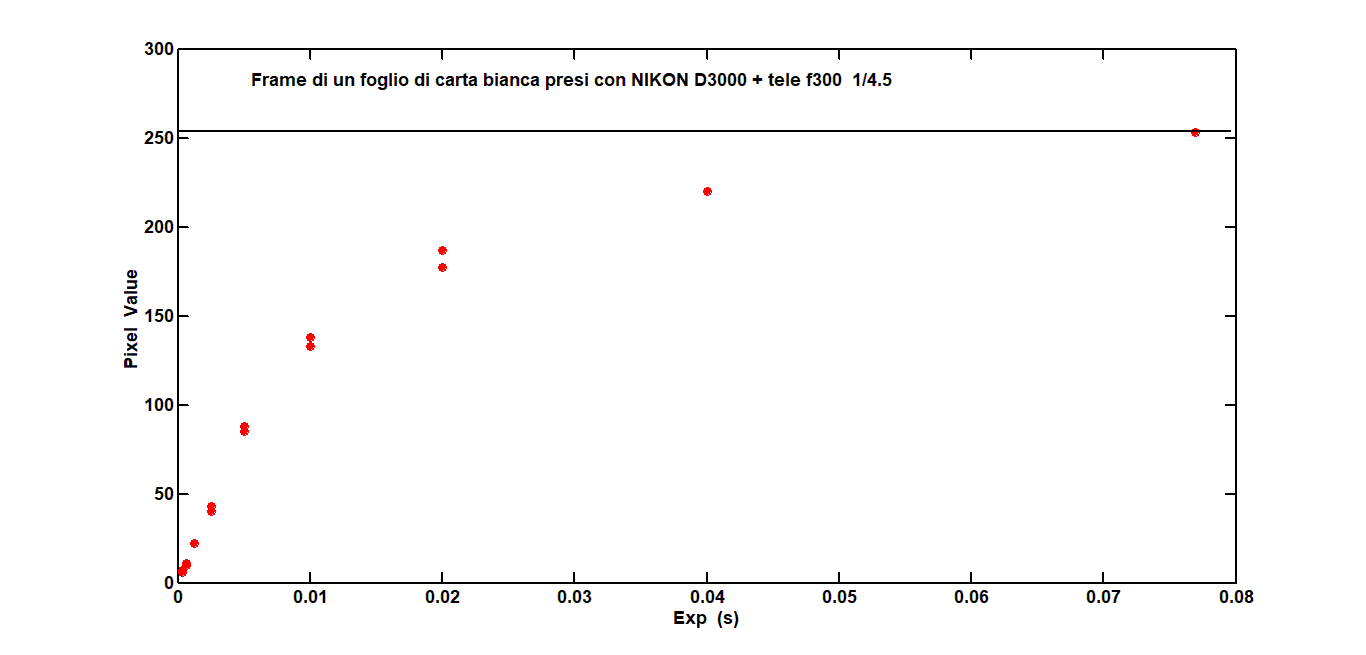
I would like to use my nikonD3000 camera, (very simple camera) for photometry of the sky at sunset and sunrise. I have performed several preliminary tests to establish some properties of the ccd sensor. An annoying and unexpected problem has arisen: The pixel values of the same subject (e.g. white sheet of paper illuminated evenly by constant light) are not proportional to the shutter speed. In some well-known manual (which I will not quote) on ccd astronomy, proportionality between PV and exposure is mentioned. Attached is a graph obtained. The system’s response is similar to a process fundamentally akin to charging a capacitor. I do not intend to purchase a new camera. For photometric purposes what to do? Thank you.2 July 2024 at 5:47 pm #623625 Robin LeadbeaterParticipant
It looks like the camera is applying a gamma correction. Is this in the jpg images ? If so the RAW images might be linear
Cheers
Robin2 July 2024 at 6:28 pm #623626ParticipantYes, they are PV read on jpg format images. The RAW format I have not tried, because matlab does not accept RAW so it takes a lot of fiddling. What is a soft that allows me to quickly read the PVs of a .RAW frame?
2 July 2024 at 11:45 pm #623627David C Rayment
ParticipantDoes this help? href=”https://www.bing.com/ck/a?!&&p=4bf8ca1abbda9c4bJmltdHM9MTcxOTg3ODQwMCZpZ3VpZD0wOGY4MmQ1Yi0wYzUxLTY5OTUtMWQ2NC0zOWViMGQ3NjY4MTQmaW5zaWQ9NTIxNw&ptn=3&ver=2&hsh=3&fclid=08f82d5b-0c51-6995-1d64-39eb0d766814&psq=measuring+luminance+with+a+digital+camera&u=a1aHR0cHM6Ly93d3cuYXRlY29ycC5jb20vYXRlY29ycC9tZWRpYS9wZGZzL2RhdGEtc2hlZXRzL3Rla3Ryb25peC1qMTZfYXBwbGljYXRpb24ucGRm&ntb=1″>atecorpSee page 8 first. Callibration starts at page 6.
2 July 2024 at 11:55 pm #623628Participant2 July 2024 at 11:57 pm #623629ParticipantThird time lucky! Does this help. See page 8 first.
3 July 2024 at 1:25 am #623630Robin LeadbeaterParticipantWhat is a soft that allows me to quickly read the PVs of a .RAW frame?
I have not used DSLR for this kind of thing for a long time but I used ISIS to decode RAW into 3 channel fits. The AAVSO DSLR
Observing manual also has some suggestions (page 25)
https://www.aavso.org/sites/default/files/AAVSO_DSLR_Observing_Manual_v1-2.pdf
but there are probably other image processing programs which can also do the jobCheers
Robin3 July 2024 at 1:29 am #623631Robin LeadbeaterParticipantIt looks like that link is not to the latest version. Here is a link to the page on DSLR photometry the AAVSO site which I guess should have the current version
https://www.aavso.org/dslr-camera-photometry-guideCheers
Robin3 July 2024 at 3:03 pm #623643ParticipantDear Fellow Astrophiles
thank you for providing me with information and links, which are valuable supports for better direction of my studies. I immediately read all the parts that are most relevant to my problems. However, the fundamental problem is not addressed: what is the general characteristic PixelValue- Exposure? The magnificent articles report precisely such graphs, but only for narrow shutter speed ranges. In that case, the general curve certainly can be confused with a straight line. Therefore, a PV-time proportionality relationship can be considered valid, and thus it is easy to reduce any photometric reading to a single shutter speed. However, when the shutter speeds are very different from each other (e.g. varying from 1/200s to 4 s), a curve emerges, virtually similar to the one in the figure. Reducing the PV readings on each frame, e.g. on those taken during a lunar eclipse, becomes difficult. Apparently no AA considers this problem.
If anyone has addressed this before I would be happy to exchange some thoughts with them.
Again, many thanks to you all.Translated with DeepL.com (free version)
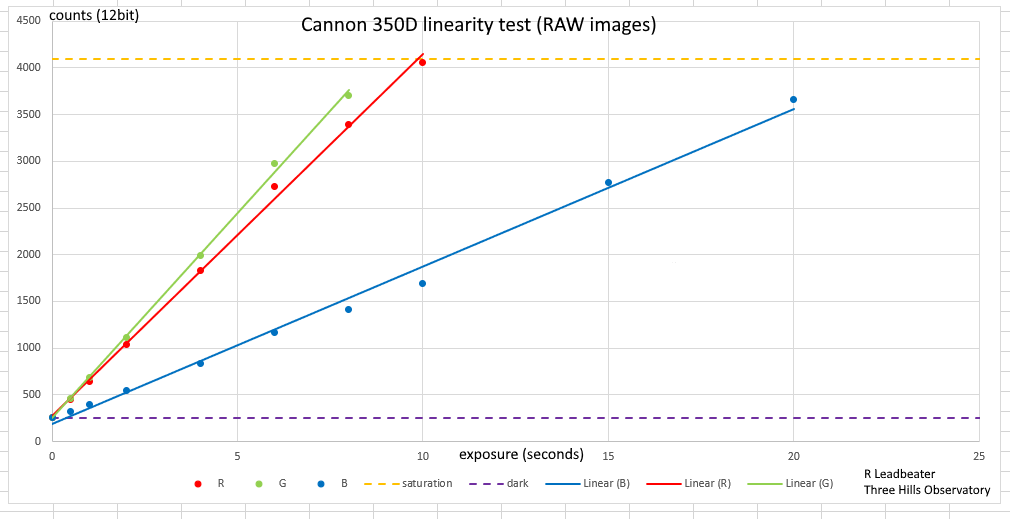
3 July 2024 at 4:28 pm #623645Robin LeadbeaterParticipantHere are the linearity results for my Canon 350D DSLR.
I measured the average intensity in an evenly illuminated area of the flat images with exposures from 0.5 to 25 seconds. I used the RAW images, separated into the three colour RGB channels. The camera is linear in all three channels up to the saturation limit (12bits=4096)
Cheers
RobinAttachments:
3 July 2024 at 4:45 pm #623647Robin LeadbeaterParticipantI strongly recommend using RAW images. jpg are not useful for science.
How are you measuring the pixel value in the image? Is this the value in a monochrome image made from the colour image? If so, check that none of the RGB channels in the colour image is saturated. (for example the G channel could be saturated but not the B and R channels and you would no know this from the mono image) This could also give the non linear effect you are seeing.
Cheers
Robin3 July 2024 at 8:29 pm #623649ParticipantRobin, I am very pleased that you have been so attentive to my troubles. And for that I take the opportunity to learn more. I only point out that the PVs in my graph are extracted from the G-band of white surface images. With RAW I cannot operate, I have to learn how to do it. Now your graphic result unbalances me quite a bit. It is exactly what I would like to have with my nikon. For the last 5 years I have been observing the colours of sunrise and sunset by mathematically processing RGB images, but without the need to do photometry. Now, I intend to start systematic observations of the brightness of the sky at zenith in the 3 RG&B bands. This is why I need the numerical pixel values. Unfortunately, my problem is also English, which I know very little. Reading and understanding just a few pages of a manual is a real feat; if it is American English, I often have to give up. The translation into English of articles I write in Italian I always entrust to a professional translator, which is not easy to find here in Italy. My wife could help me, but you know how women are, especially wives lose patience immediately. Which is obviously not allowed to me, when there are jobs (especially difficult and heavy ones) to be done around the house: immediately and done right! Anyway, I will follow your instructions very carefully.
Sincerely regards4 July 2024 at 4:46 pm #623664ParticipantRobin, today I promptly took RAW images (NEF nikon) of a uniformly lit white wall. As usual just varying the exposure time (from 1/50 to 1/3200); measured the Pixel Value on each RG&B channel with the soft AIP4Win. Unfortunately, the result is identical to the jpg: graph similar to the charge curve of a capacitor in RC; asymptote (maximum value) always 255. Probably my computer inexperience is deceiving me. You present a graph that is not only linear, but with values on the ordinates also much higher than my 255. I would ask you for as explicit an explanation as possible. Thank you
4 July 2024 at 6:21 pm #623666Robin LeadbeaterParticipantYou present a graph that is not only linear, but with values on the ordinates also much higher than my 255. I would ask you for as explicit an explanation as possible.
jpg have only 256 levels per channel (8 bit) but many DSLR including the Nikon D3000 take images using 12 bits (4096 levels) so you should be able to see 4096 levels in RAW images from your camera. I have not used the D3000 or AIP4WIN though so I have run out of ideas I am afraid.
Cheers
Robin4 July 2024 at 8:10 pm #623668ParticipantRobin, the answer to my dilemma can be found in the AAVSO book you recommended, which I did not know.
The non-linearity between pixel value and exposure time is a peculiarity of the CCD sensor. My DSLR actually mounts a CCD.
“4.5.2 Exposure time, saturation, and non-linearity
Non-linearity is even more dangerous in photometry because it is less
obvious to detect than is saturation. Fortunately, DSLR cameras now exclusively use CMOS sensors that
do not have the problem of non-linearity that CCD sensors do.”
So, for me, three possibilities are proposed:
1- Abandon my observation programme;
2- Buy another camera with cmos;
3- Devise a mathematical procedure for the reduction to the same exposure.
I intend to rule out 1 a priori. I am heading towards the third, as the second is not for my pocket.
Greetings7 July 2024 at 12:56 am #623679 Grant PrivettParticipant
I believe AstroArt can handle Nikon RAW files – though I have never done so myself.
It is probably a bad idea to estimate the linearity of a sensor from jpgs as the scaling will be different for each picture.
7 July 2024 at 10:13 am #623682ParticipantHi, Grant
It is actually not a good idea to do photometry with jpg formats. Unfortunately I have few resources and have to make do with those. However, with 256 levels you span a range of about 6 stellar magnitudes. And apart from the smallest variation still observable (sensitivity), 6 mag is not exactly small. For what you say, you are absolutely right, but I think that if, for example, I have to measure the height of a tree but don’t have a tape measure, what do I do? Do I leave it alone? No, I do it by eye: the tree is 8 m high + or – 2 m; I can tell at least that it is a cherry tree and not an olive tree. Also, PV-exposure linearity would be necessary to reduce PV measurements all at the same exposure time.
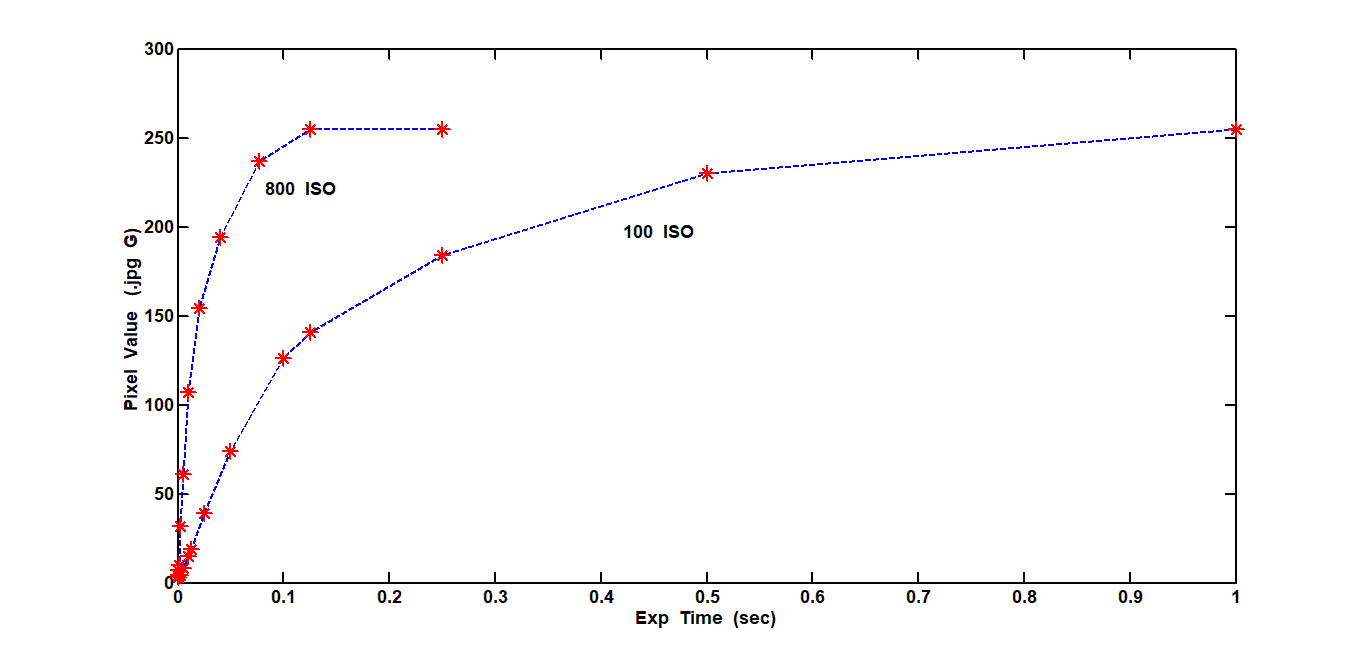
In my case, everything is more complicated. The attached graph shows PV-time for two iso values 100 and 800. I think I can solve the problem by observing that the two curves are similar to the charge function in the RC circuit. Of this it is not difficult to calculate the time constant, which is done for these two graphs. The awkward problem is having to apply the same mathematical algorithm to each photograph in order to use it. Robin’s graphs would be ideal for me, but only because the equation of a line goes in place of the charge law of a capacitor.
Of course, I will have to get the soft stuff you suggest.
Thank you.
Translated with DeepL.com (free version)7 July 2024 at 10:42 am #623683ParticipantThese are the graphs for 100 and 800 iso, from images of a white sheet, uniform and constant illumination taken with nikon D3000
Attachments:
7 July 2024 at 4:49 pm #623687Grant PrivettParticipantJust had a thought. Could you collect a bunch of Nikon RAW format images, allow the DeepSkyStacker software to align them and output a median filtered image in FITS format?
DeepSkyStacker certainly used to be free – AstroArt is not (though the demo version used to be).
Just a thought.
7 July 2024 at 6:55 pm #623692 Dr Paul LeylandParticipant
Another thought: check this link – https://imagemagick.org/script/download.php
Completely free and, on my systems at least, thoroughly capable of conversion between almost any image format and almost any other, not to mention a vast amount of image munging abilities.
-
AuthorPosts

- You must be logged in to reply to this topic.