› Forums › Variable Stars › SS Cygni has started outburst again
- This topic has 8 replies, 2 voices, and was last updated 1 year, 10 months ago by
 Mr Ian David Sharp.
-
AuthorPosts
-
23 July 2024 at 9:54 am #623866
 Mr Ian David SharpParticipant
Hi all,
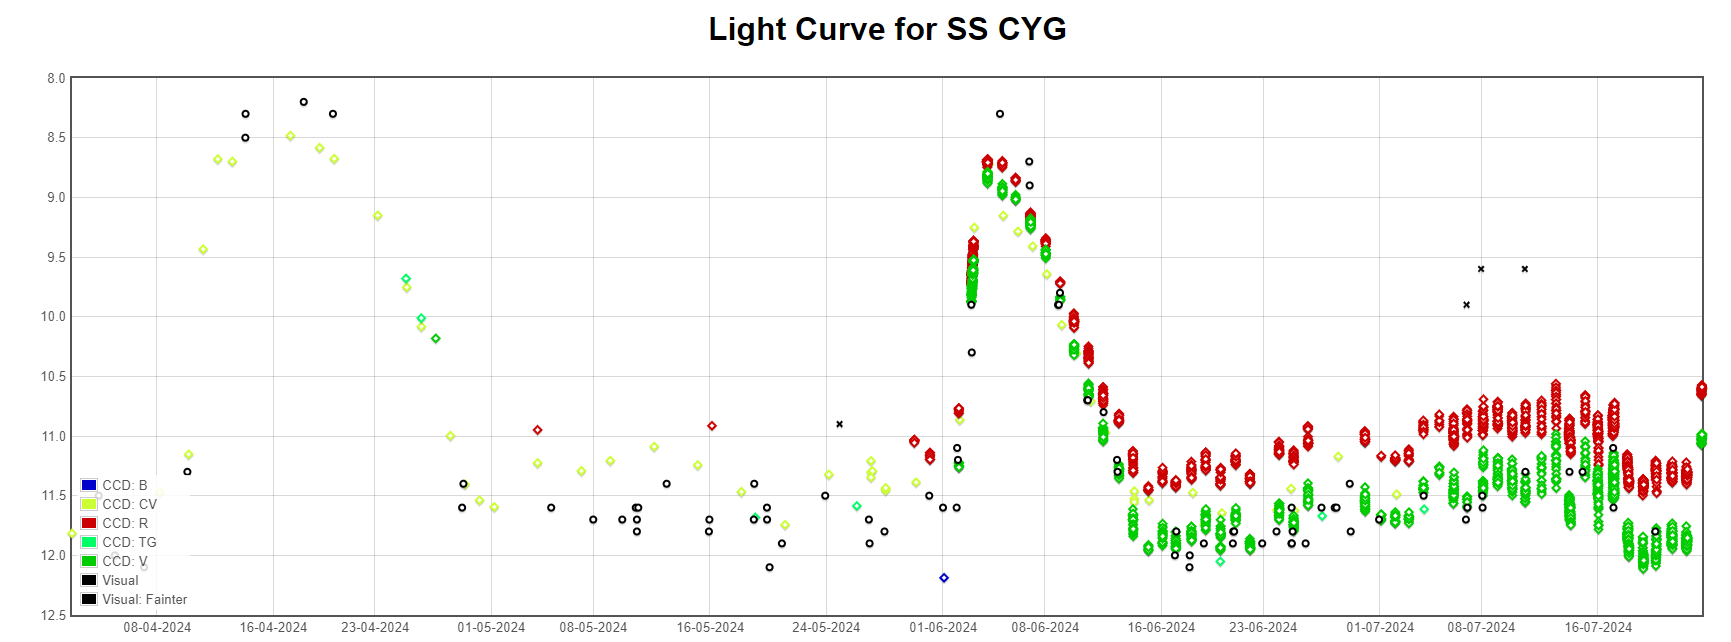
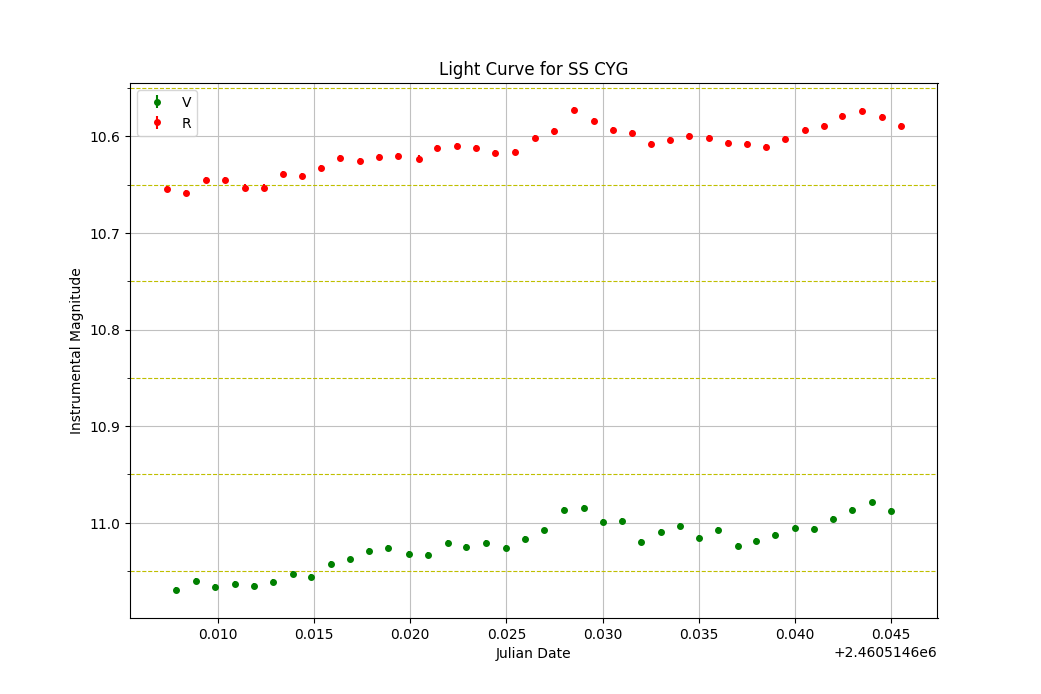
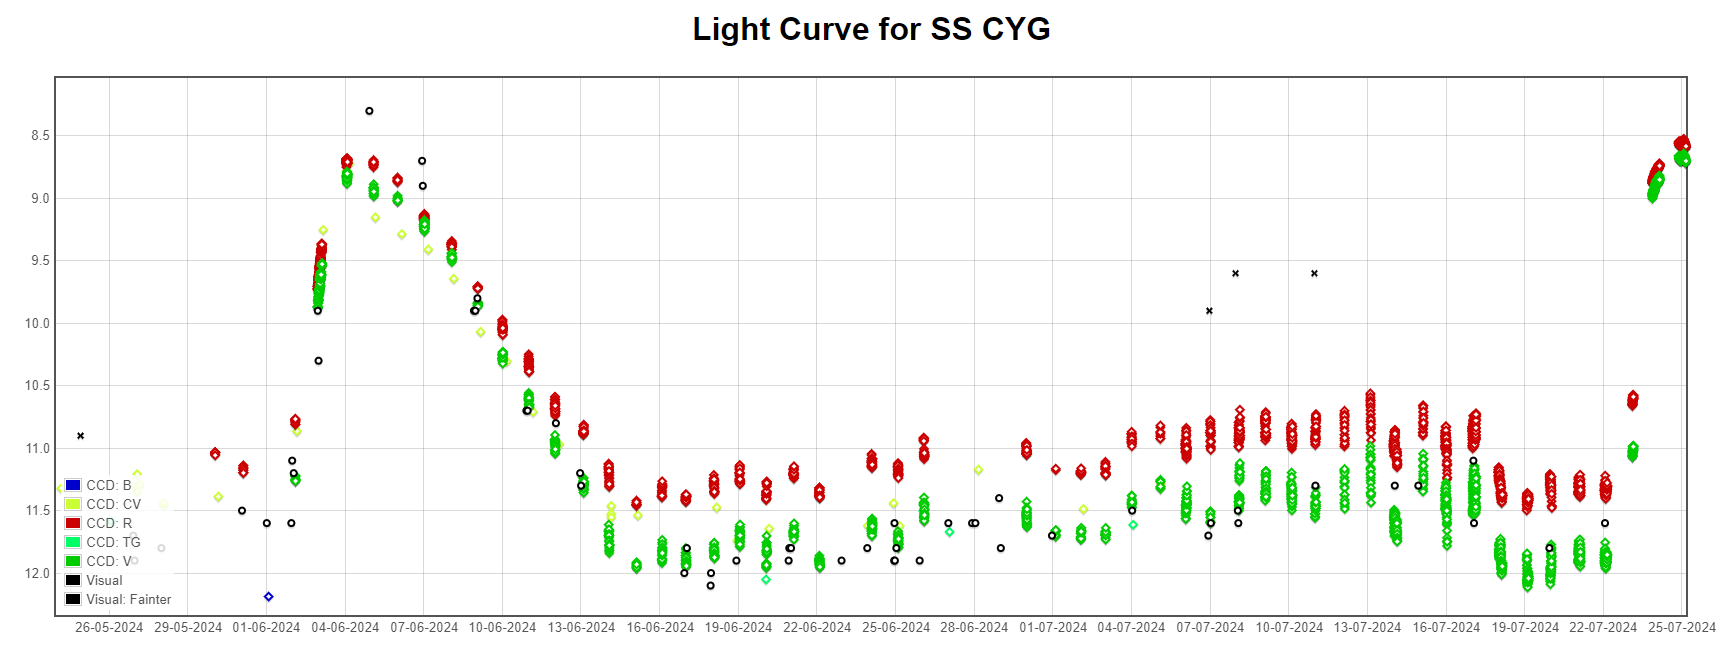
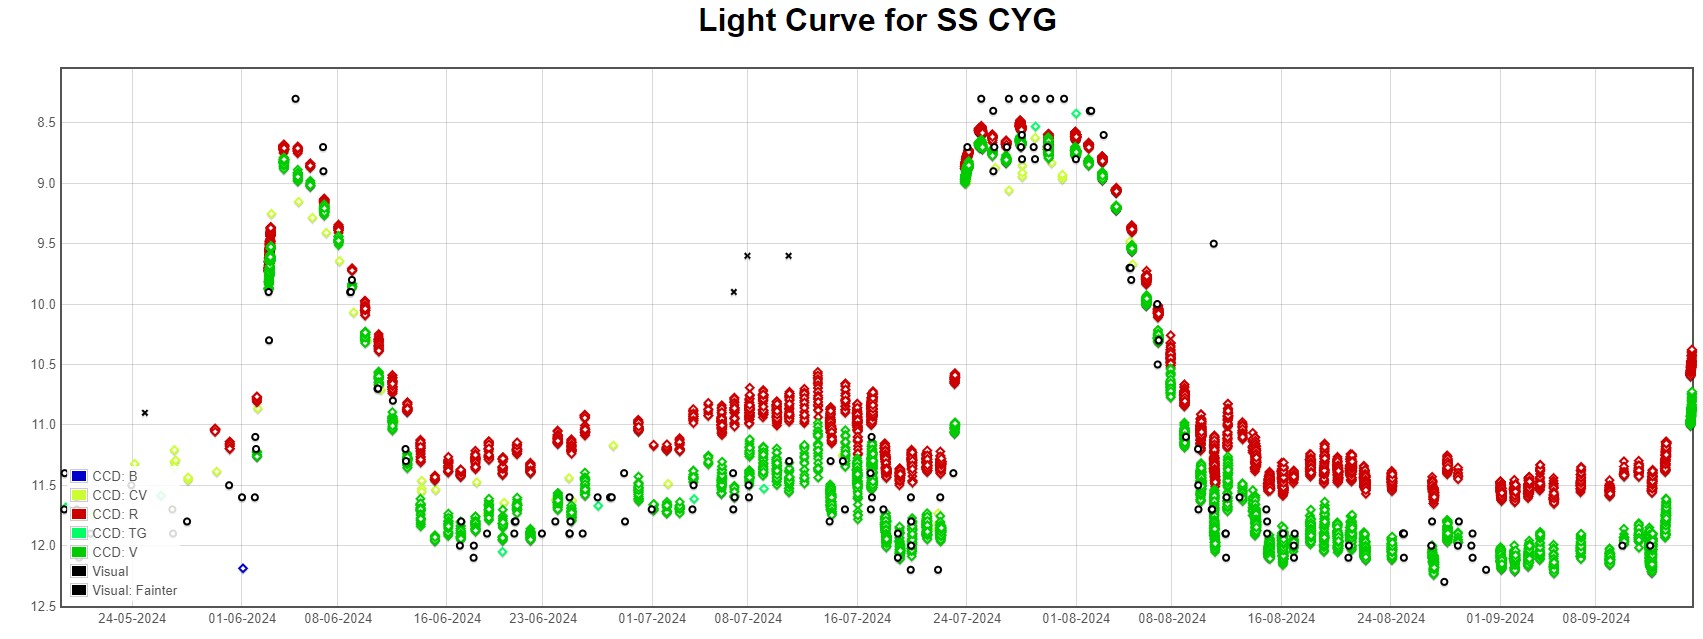
I have been intensively imaging SS Cyg for the past few weeks, ever since I reported its last outburst and I am pretty confident a new one is just underway.
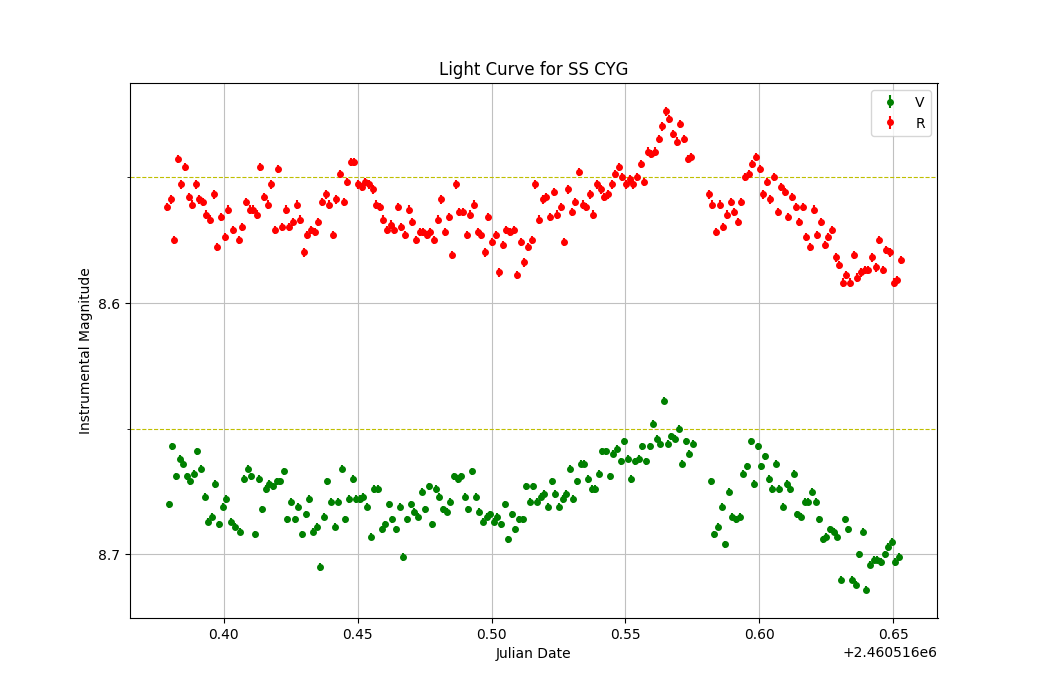
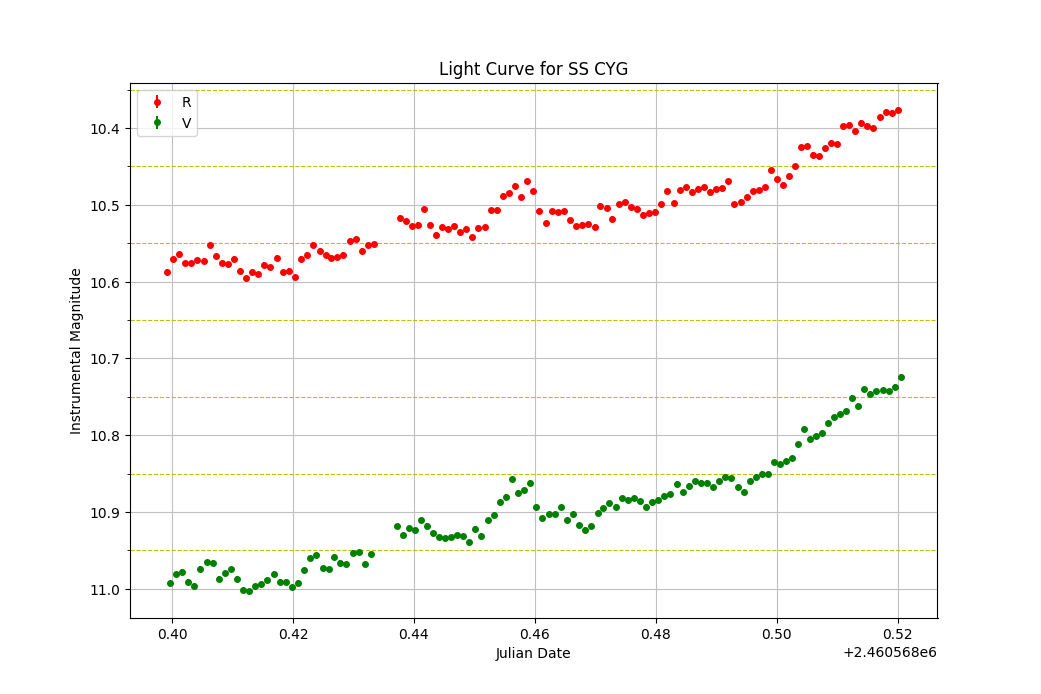
See the attached graphs which show the light curve from April where my last two sets of R and V measurements from last night are the latest points. Also, a chart of last nights measurements showing the rise.
Notice the increase in variability as the cycle progresses towards the outburst. I have seen as much as 0.4-0.5 magnitudes in both R and V over the course of 2 or 3 hours in some nights.
Cheers
Ian.Attachments:
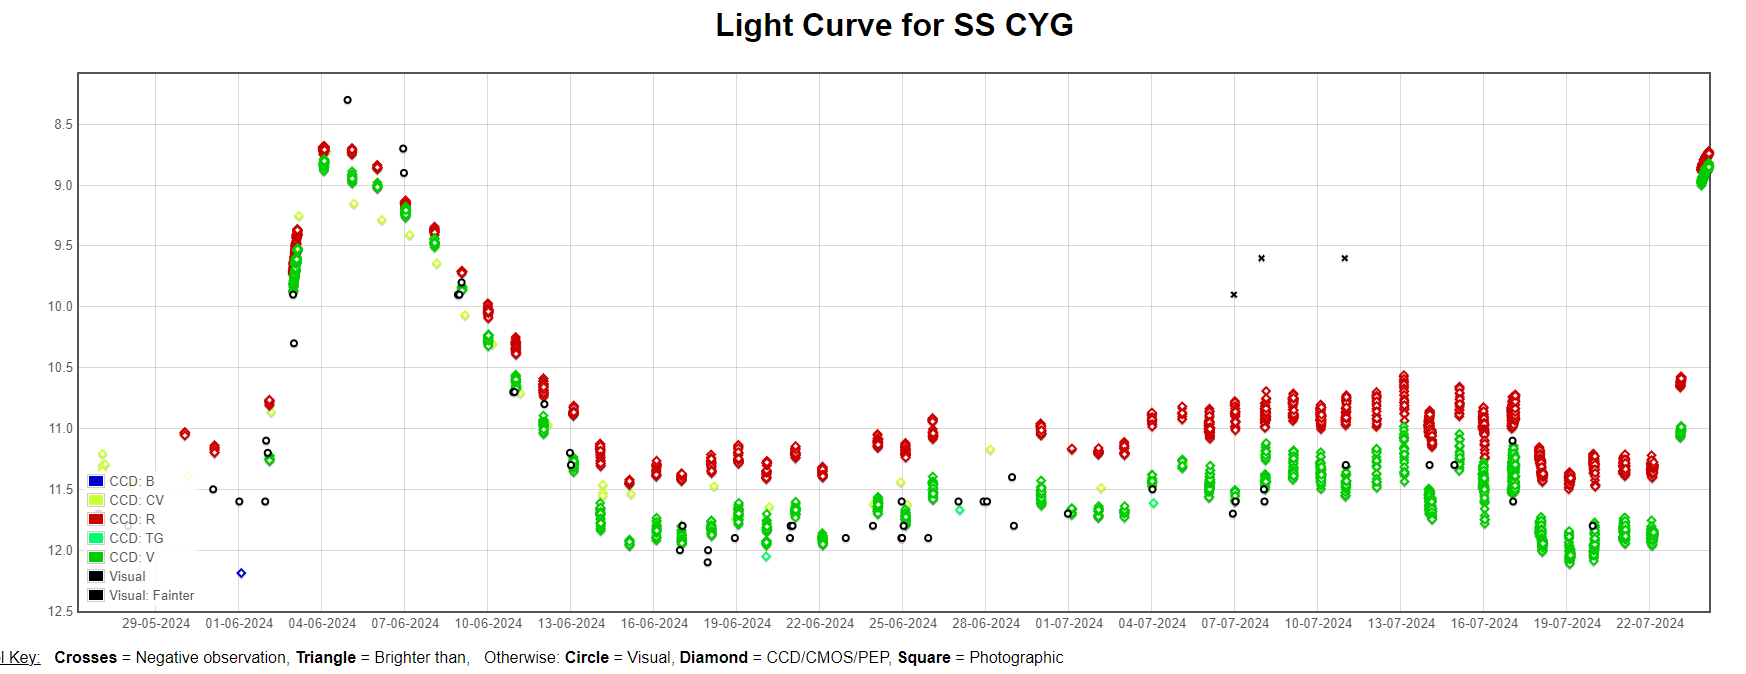
24 July 2024 at 8:40 am #623881Mr Ian David SharpParticipantHere is an update from last night where I imaged SS Cyg the whole night with 545 measurements in the R and V. It was at, or near its peak brightness.
Cheers
IanAttachments:
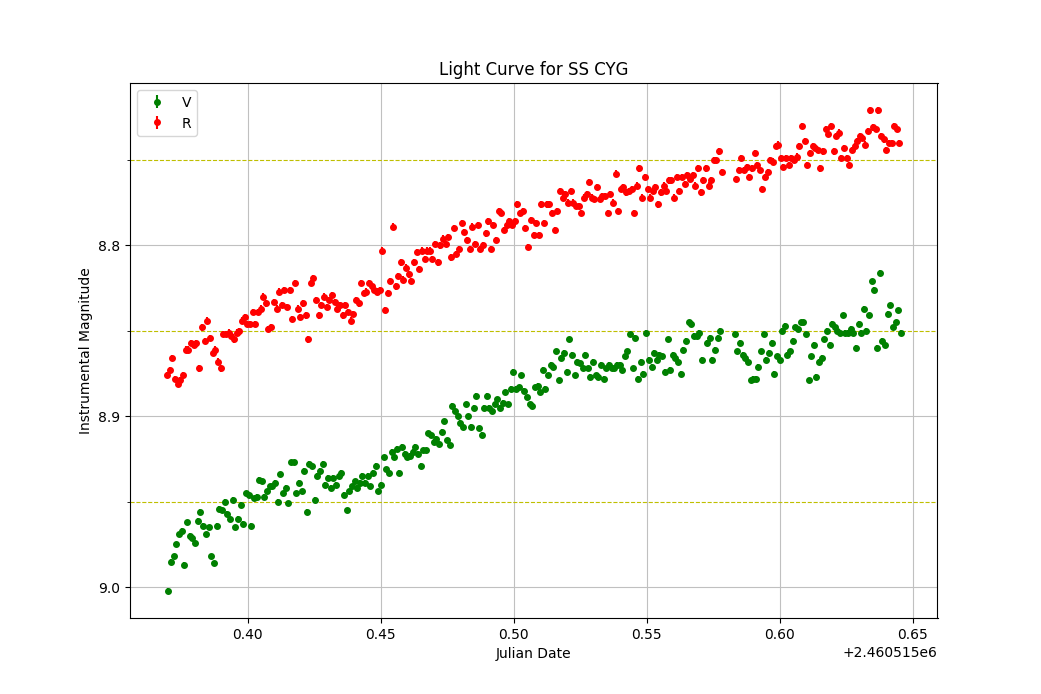
25 July 2024 at 4:57 pm #623892Mr Ian David SharpParticipantI think last night (24/25 July) was the peak. I took another 6.5 hour run. Quite a bit of variability seen in the R and V plot.
Cheers
Ian.-
This reply was modified 1 year, 12 months ago by Mr Ian David Sharp.
Attachments:
25 July 2024 at 8:15 pm #623897 Jeremy ShearsParticipant
Nice work Ian 👍🏻
7 August 2024 at 4:55 pm #624182Mr Ian David SharpParticipantHi all,
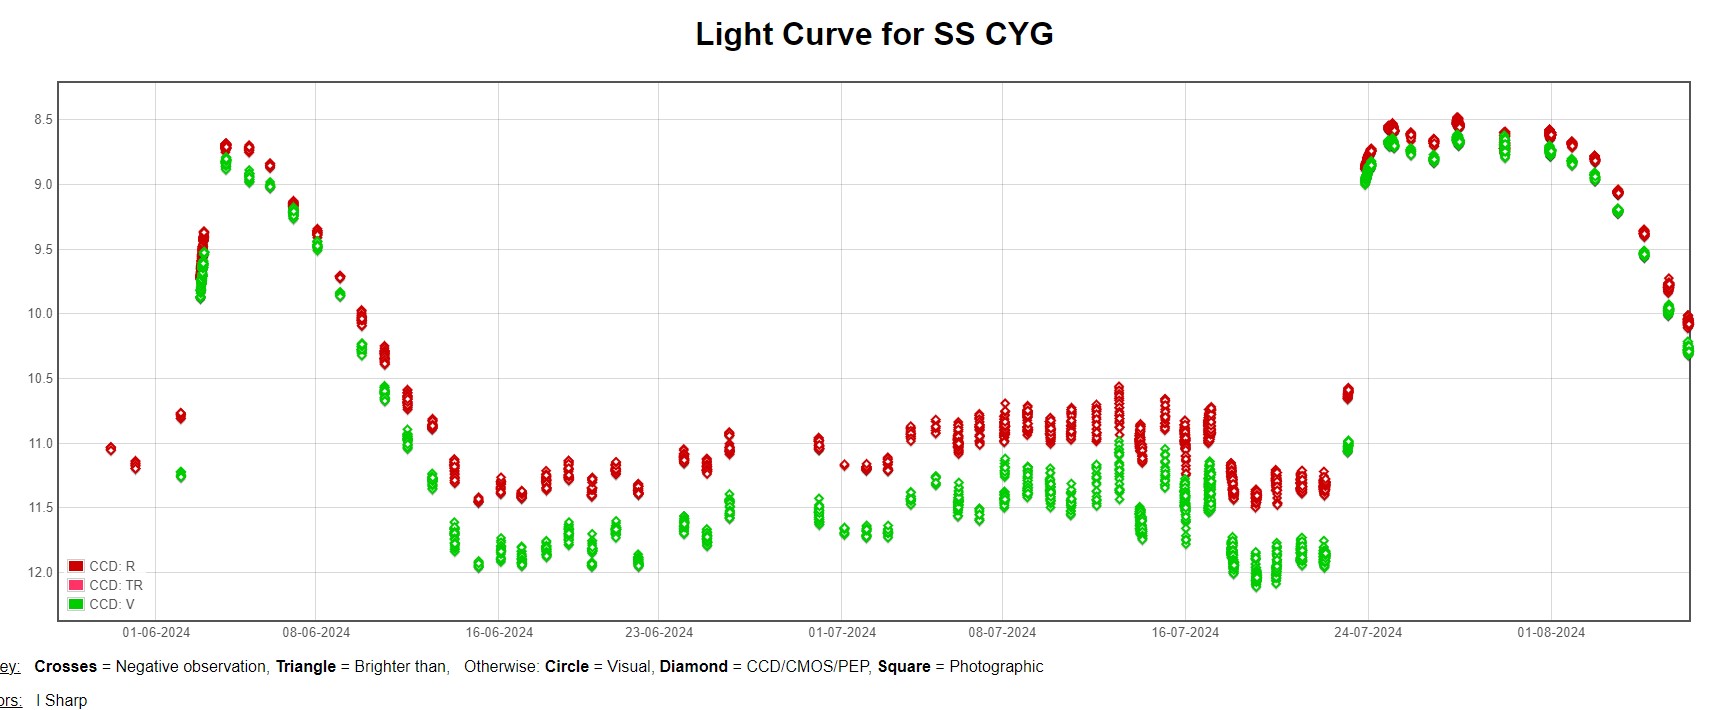
Here’s an update on SS Cygni. I’ve been intensely monitoring the star for the last two outbursts and have made nearly 7,000 photometric measurements in the R and V bands in that time. It’s noticeable how variable the magnitude is especially during the dim portion of the cycle pre-outburst. Also, two very different widths of outburst.
See attached light curve from the photometry database.
Cheers
Ian.Attachments:
8 August 2024 at 10:35 am #624187Jeremy ShearsParticipantFascinating details in the light curve you are picking up in your photometry, Ian! Intriguing slow rise during quiescence, followed by a drop leading into the next outburst.
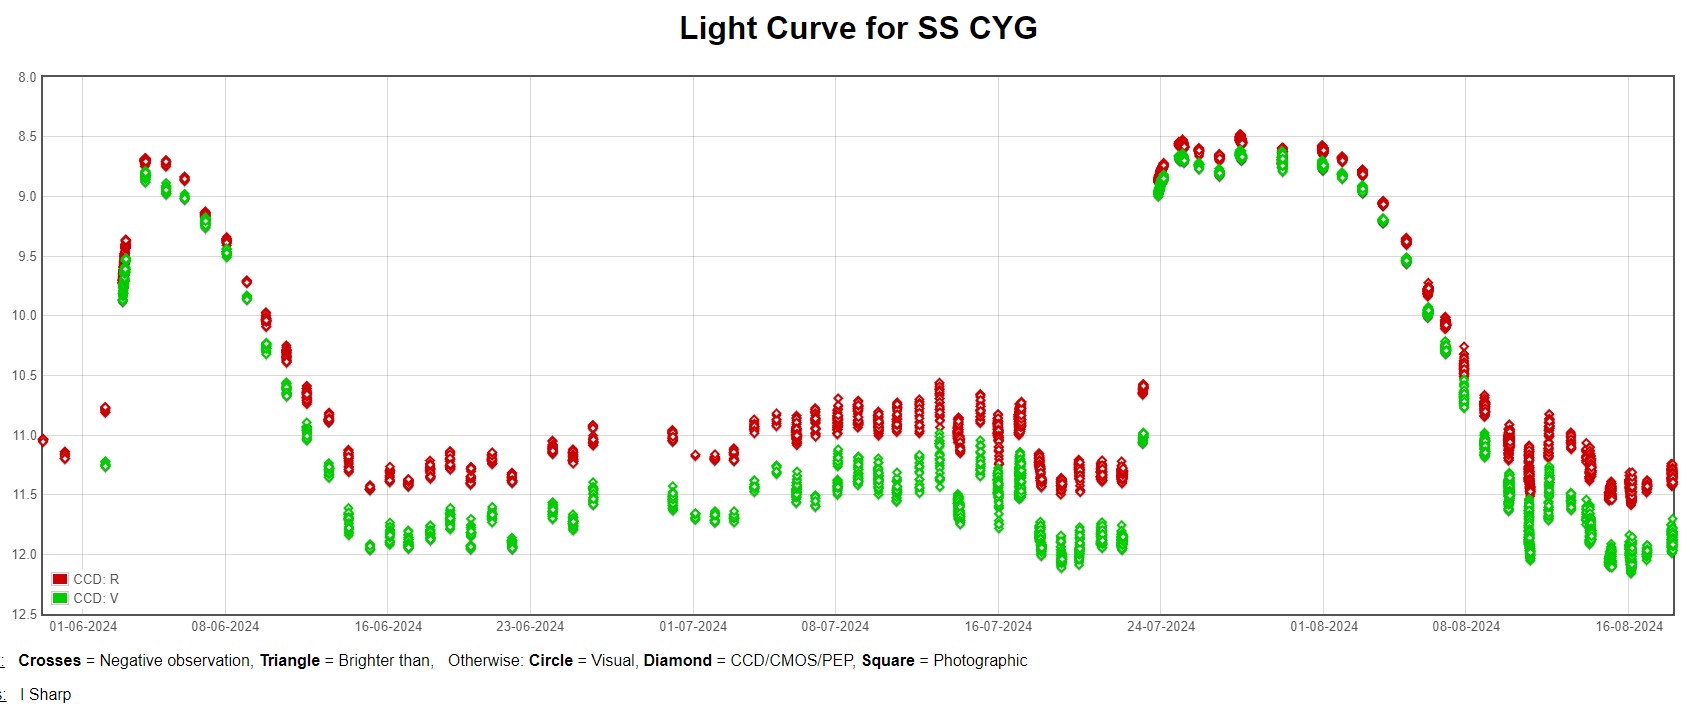
18 August 2024 at 5:13 pm #624335Mr Ian David SharpParticipantAnother update, nearly 10,000 brightness measurements in the last two outbursts.
There are some fascinating details in the variability within the daily bursts of measurements. I need to analyse them further to see what they contain.
Cheers
IanAttachments:
19 August 2024 at 11:14 am #624344Jeremy ShearsParticipantImpressive coverage, Ian!
15 September 2024 at 10:36 am #625057Mr Ian David SharpParticipantHi all,
I’ve been continuing my intensive monitoring of SS Cyg and I can report another outburst has started. See attached with last night’s results.
Cheers
Ian.Attachments:
-
AuthorPosts
- You must be logged in to reply to this topic.