› Forums › Spectroscopy › V694 Mon Spectroscopy
- This topic has 3 replies, 3 voices, and was last updated 10 years ago by
 Andy Wilson.
-
AuthorPosts
-
10 March 2016 at 4:10 pm #573539
 Andy WilsonKeymaster
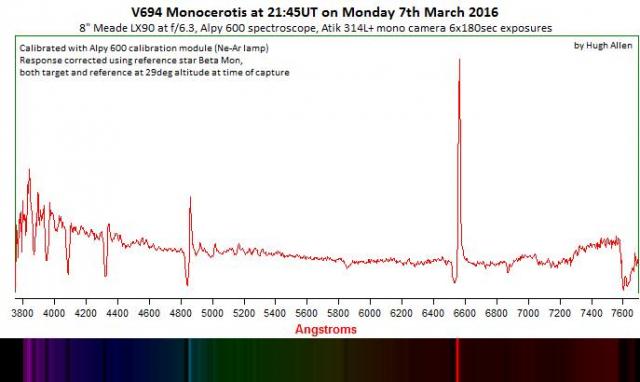
On 7th March 2016 3 observers obtained the following spectra of the symbiotic variable star V694 Mon. On the same night Gary Poyner estimated the star to be at magnitude 9.8, while David Boyd obtained CCD photometry giving a V magnitude of 9.54 and a B magnitude of 9.92.
The V694 Mon system is comprised of a red giant with a white dwarf companion. The red giant is expelling material via a strong wind, and some of this wind is captured by the white dwarf forming an accretion disk. Connected to the accretion disk and white dwarf there are bipolar jets, with one of the jets directed towards us, so we are looking almost directly down the jet.
This year the star has entered an active phase, with increased brightness and rapid changes. This happens when the inner accretion disk becomes unstable, likely indicating an increased rate of infall of material from the accretion disk onto the white dwarf.
This first spectrum obtained by Hugh Allen is a low resolution spectrum at about R=600. (Spectral resolution is a measure of how fine a detail can be resolved in a spectrum, with a higher value corresponding to higher resolution.) The advantage of this low resolution is that it covers a wide range of wavelengths, sacrificing resolution for wavength coverage. Hugh used an Alpy 600 spectrograph mounted on an 8″ Meade.
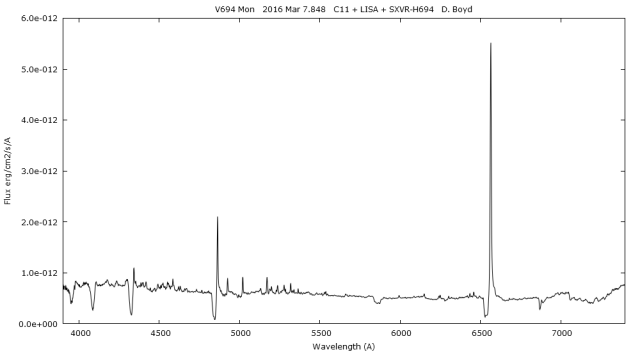
The second spectrum is by David Boyd using a LISA spectrograph mounted on a Celestron C11. The LISA gives a slightly higher resolution at around R=1100 enabling more detail to be discerned in the spectrum. The narrow emission lines are more clear in this spectrum, which is also flux calibrated. This is of considerable benefit since it enables easy comparison between spectra, as well as a more thorough analysis of the physical processes. These narrow emission lines are thought to originate in the accretion disk.
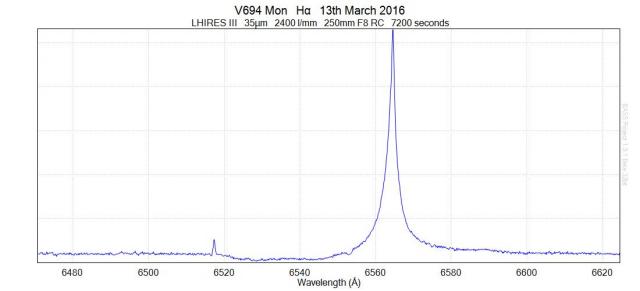
The final spectrum is my own high resolution spectrum centered on the H-Alpha emission line, taken using an Lhires III spectrograph mounted on an Altair Astro 10″ RC. The resolution of this spectrum is around 10500 and shows detail in the H-Alpha emission and blue shifted absorption. This absorption component is due to hydrogen in the jet which is travelling towards us at very high speed, resulting in a blue shift of the wavelength compared to the normal rest wavelength of H-Alpha at 6563 Angstroms. The absorption appears to end somewhere around 6510 Angstroms though it is a little indistinct. This gives a maximum blue shift of about 40 to 50 Angstroms, which corresponds to a maximum velocity in the jet of around 1800 km/s to 2300 km/s on 7th March.

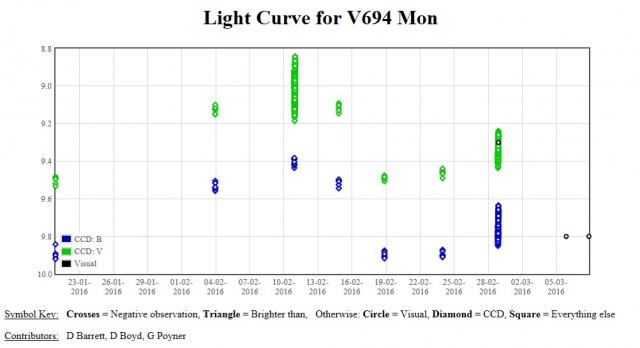
Here is a light curve from the BAA VSS online database showing the observations submitted during 2016. It can be seen that the spectra were taken when V694 was about 1 V magnitude below its maximum during this outburst.
For more information of V694 Mon there is an excellent article starting on page 32 of the ARAS Eruptive Stars information letter, which was also used to help compile the explanation of the spectra in the post:
http://www.astrosurf.com/aras/novae/InformationLetter/ARAS_EruptiveStars_2016-01.pdf
The AAVSO also have an alert notice for observations in support of the NASA Chandra X-ray observatory:
https://www.aavso.org/aavso-alert-notice-538
Regards,
Andy Wilson
21 March 2016 at 11:11 pm #577286 Steve CuthbertParticipant
Nice post Andy.
Would I be correct in seeing a P Cyg feature in Hugh and David`s spectra?.
Steve
22 March 2016 at 9:20 am #577287 David BoydParticipant
Yes, in fact you can see the P Cygni profile in the Balmer lines in all three spectra. It is just spread out in Andy’s hi res spectrum of the H-alpha region.
David
22 March 2016 at 5:39 pm #577290Andy WilsonKeymasterThanks Steve.
Yes, that is a P Cygni profile in David and Hugh’s spectra, and as David points out it is also visible in my spectra, it is just very very spread out as it is at high resolution.
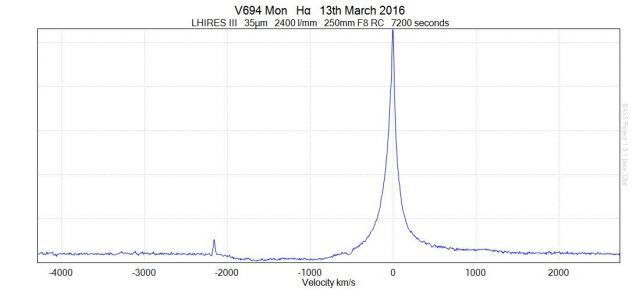
I obtained an even better spectrum on the 13th March. This has a slightly cleaner signal and you can start to see structure within the P Cygni absorption profile. For example the extra absorption around 6553 Angstroms. There is also an interesting emission peak at about 6517 Angstroms. I’m not sure what element this is from, but I would suspect it comes from has in the accretion disc. It even appears to show its own small P Cygni profile, though it is possible this is just noise. Note if this was a P Cygni profile then it would be from material travelling relatively slowly compared to the huge P Cygni at H Alpha.
I thought I’d show the same spectrum, but this time converted to velocity relative to the central H Alpha emission peak. This shows the absorption to the blue (shorter) wavelength goes beyond -2000 km/s. This is due to the hydrogen in the jet absorbing light, but it is blue shifted due to its fast velocity towards us.
Cheers,
Andy
-
AuthorPosts
- You must be logged in to reply to this topic.