MISSION 29P and James Webb Space Telescope data analysis
<= Back to MISSION 29P Homepage
(Version published 2024 December 30)
Abstract
The main conclusions from this comparative study of JWST and contemporaneous ground-based observations conducted by the MISSION 29P group are:
- The JWST observations were carried out at an epoch characterised by a quiescent nucleus exhibiting relatively normal cometary activity involving steady-state dust ejection and distinctive gas flows not mirrored by morphology of the dust coma. Although a weak outburst had taken place 6 days earlier, all of that ejecta had moved out of JWST’s field of view before the JWST epoch.
- A particularly strong outburst took place about 30 ± 6 h after the JWST epoch appearing from a central region of the nucleus that had been devoid of outgassing jets. Solar insolation would have increased rapidly as the sun rose over that region and yet the crust appeared to be efficiently sealed to gas flow. This finding may be the first of its kind to show effective sealing of 29P’s crust that would have inevitably resulted in a pressure build-up beneath the crust.
- We calibrated the JWST dust coma profile using 1.0-m and 2.0-m ground-based images (courtesy of Las Cumbres Observatory) taken <10 h either side of the JWST epoch. The calibration enabled us to compare the JWST nucleus magnitude with 2.0-m ground-based observations conducted over 10 years that provided absolute magnitudes of the nucleus by extrapolating the coma intensity to zero radius whilst also correcting for seeing. The ensemble-average value of 9.77 ± 0.04 obtained for R(1,1,0) was used to calculate the coma dust mass as a function of radius and quadrant direction.
- The CO calibration provided by Faggi et al. (2024) in Fig.2, Inset c was used to map the CO column density along a vector that included the main CO outgassing northern jet and the CO-quiescent southern direction. The upper limit of the dust-to-gas mass ratio of the northern jet was found to be 0.010 ± 0.002 (assuming coma particles of 1 micron radius on average), i.e. much lower than has been observed in other cometary jets, whereas in the quiescent southern direction, the mass ratio was close to 0.12 ± 0.03, i.e. typical of a gas-rich jet in other comets. These results support the interpretation that the main CO outgassing jet entrained a much smaller fraction of particulate ejecta indicative of a consolidated crust trapping a subsurface cryomagma reservoir rich in gas/liquid under significant pressure.
- We analysed the coma profile of each spectral slice and by extrapolating each profile to zero radius, we separated the nucleus and coma components in the spectrum. Coma emission lines were identified in the coma component which have been tentatively assigned to CH4, C2H6, CO, CO2, H2O and possibly H2CO.
- No significant emission feature was evident from the nucleus component spectra. In contrast, some weak absorption bands were found together with a strikingly marked absorption feature in the 2.33 ‒ 2.38 micron range that corresponds with the location of strong absorption lines for solid CO and solid CH4. Our interpretation is that this represents evidence of solid ice at the surface comprising a mixture of solid CO, methane and possibly other linear alkanes such as ethane and propane at 40‒70 K.
- Temporal and seasonal variations in the absolute magnitude, R(1,1,0) of the nucleus did not exceed 0.25 mag, which, with recent occultation results, tend to rule against 29P’s nucleus being bi-lobate in shape.
Preface
The small-solar-system-body community has been rather restrictive in its characterisation of cometary activity preferring to regard all comets as composed of solid material (mainly inert dust), frozen ices that sublimate on heating and some trapped gas. This limited comprehension has been reinforced by several space probe flybys and visits to cometary nuclei, which have occasionally witnessed the appearance of gas-driven dust jets reinforcing this interpretation. The repeated outburst behaviour of 29P cannot be explained by such a simple model so when JWST observed the comet in 2023, it was hoped that new insight would be gained.
As it happened, JWST’s observing window coincided with a time when the nucleus had been untypically quiescent following a weak mini-outburst some 6 days earlier. As a result, it exhibited rather normal cometary behaviour when peered at by JWST. It is therefore important to contextualise the observations by reference to 29P’s behaviour ahead of, and immediately following the JWST epoch.
Objectives
This webpage aims to present an in-depth analysis of MISSION 29P observations relevant to the JWST observations of 29P conducted on 2023 February 20. Publicly-available JWST data have also been analysed to link the coma profile and nucleus properties determined from ground-based Cousins-R photometry of images taken through SDSS-r filters with that derived from JWST spectral data centred on the Sloan r passband. In all, the JWST data studied comprised 941 slices of spectral data ranging from 0.6025 micron to 5.3025 micron, each slice being a 30×30 pixel image of spectral bandwidth 0.005 micron and equivalent to an area of 3.26 arcsec square projected on the sky. Assignments have been proposed here to account for some emission and absorption features identified in the spectral data. By calibrating JWST coma intensity vs. wavelength measurements using ground-based observations, we can also examine how the dust-to-gas mass ratio of the inner coma compares to that of typical comets.
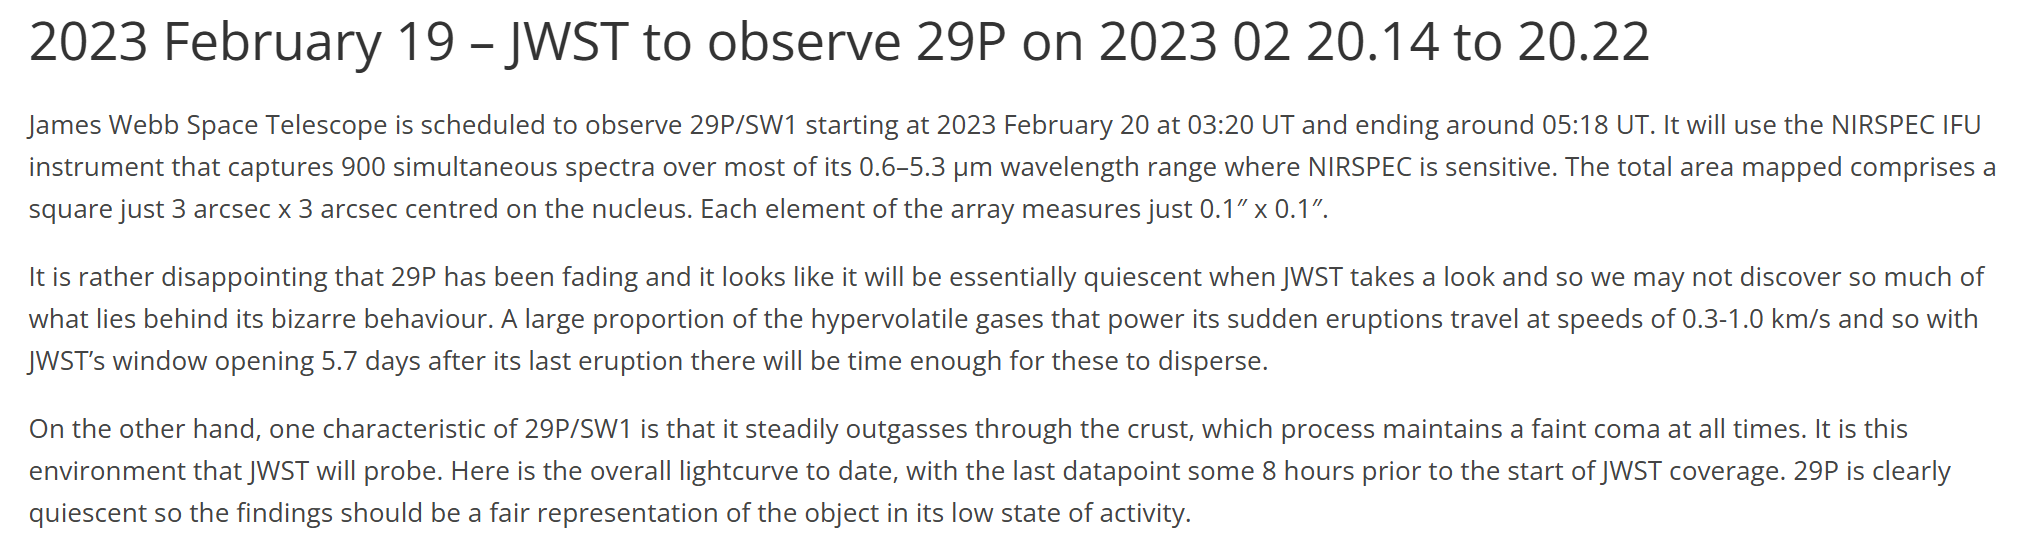
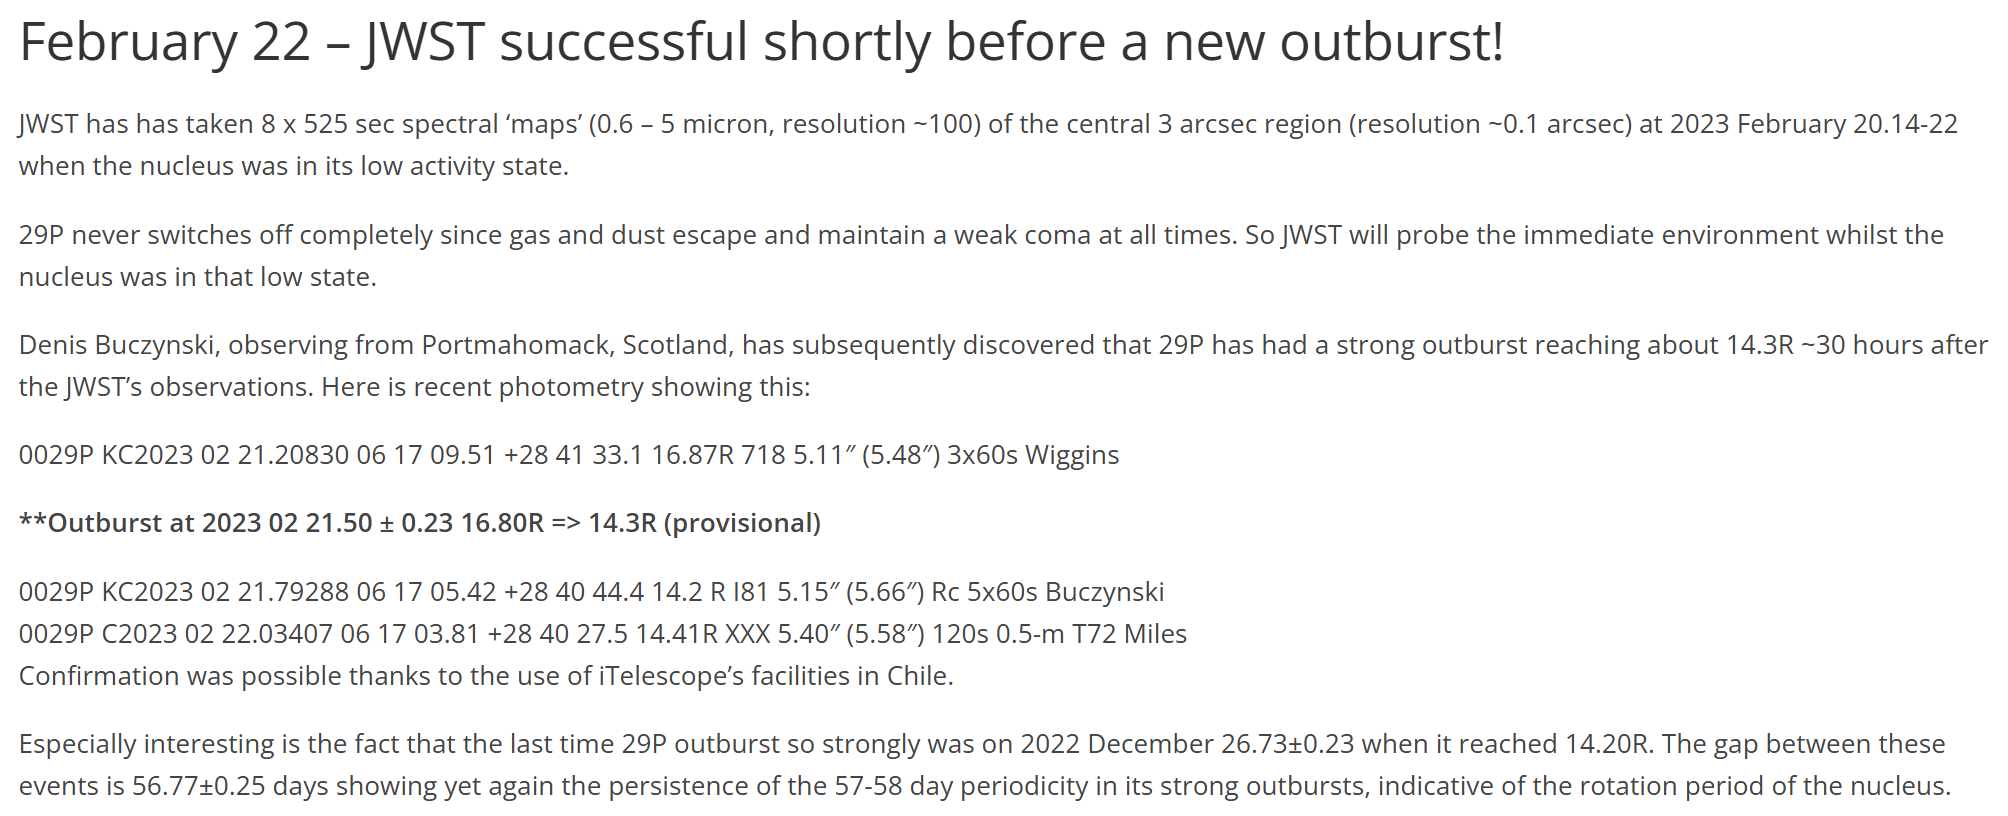
Here are the links to News items that were posted on this website immediately before (February 19) and after (February 22) the JWST epoch (February 20.16-20.22).
JWST observations
The JWST observations were conducted under Proposal 2416 “Measuring Volatile Production in Active Centaurs with JWST NIRSpec“, led by Dr Adam McKay of the American University.
Co-investigators were:
Dr Michael S Kelley, University of Maryland
Dr Lori M. Feaga, University of Maryland
Maria Womack, University of Central Florida Board of Trustees
Dr Michael A DiSanti, NASA Goddard Space Flight Center
Dr Charles Schambeau, University of Central Florida Board of Trustees
Dr Yanga Fernandez, University of Central Florida Board of Trustees
Olga Harrington Pinto, University of Central Florida Board of Trustees
Dr. Geronimo Villanueva, NASA Goddard Space Flight Center
Dr. Kacper Wierzchos, University of Arizona
Dr. James M Bauer, University of Maryland
29P was the brightest of several active Centaurs observed by JWST using the NIRSpec Integral Field Unit (IFU) prism mode to measure production rates of H2O, CO2, and CO, as well as to search for water ice absorption in the coma. All observations had dedicated background observations sequenced together with the science observations to ensure the most accurate background correction. The first JWST paper on 29P by Faggi et al. was published in Nature Astronomy in 2024 July in which an overall 0.75‒5.3 μm spectrum was reproduced showing the very strong CO2 and CO emission lines from the coma.
Papers have recently been published presenting JWST spectra over the same spectral range for several other Centaurs and TNOs. These include:
Measurement of D/H and 13C/12C Ratios in Methane Ice on Eris and Makemake: Evidence for Internal Activity. W.M. Grundy et al., Icarus, 411, 115923 (published 15 Mar 2024).
A tale of 3 dwarf planets: Ices and organics on Sedna, Gonggong, and Quaoar from JWST spectroscopy. J.P. Emery et al., Icarus, 414, 116017 (published 15 May 2024).
Widespread CO2 and CO ices in the trans-Neptunian population revealed by JWST/DiSCo-TNOs. M.N. De Prá et al., Nat. Astron. (published online 22 May 2024).
Unveiling the ice and gas nature of active centaur (2060) Chiron using the James Webb Space Telescope. by N. Pinilla-Alonso et al., Astron. & Astrophys. 692, L11 (published online 18 Dec 2024).
Thermal evolution of trans-Neptunian objects through observations of Centaurs with JWST. J. Licandro et al., Nat. Astron. (published online 19 Dec 2024).
A JWST/DiSCo-TNOs portrait of the primordial Solar System through its trans-Neptunian objects. N. Pinilla-Alonso et al., Nat. Astron. (published online 19 Dec 2024).
As a general comment, none of the spectra in these papers come close to resembling that of 29P again showing the uniqueness. Of course a big difference is that all of these distant bodies do not exhibit a strong cometary coma as 29P does. We shall see later how it is possible to largely separate the nucleus component of 29P’s spectrum from that of the coma to reveal some absorption features partly hidden by emission from the coma.
General activity of 29P during its 2022‒2023 apparition
The lightcurve shown in Figure 1 depicts 29P’s activity during its entire apparition spanning 2022 to 2023. The JWST observing window (February 20) came a day or so before a strong eruption of the nucleus, the intensity of which equalled 18 nucleus-equivalents. JWST would have captured the eruption itself had the observing window been 30 hours later! Some 32 discrete outbursts were detected ranging in intensity from 0.3 to 164 nucleus-equivalents (n.-e.), where 1 n.-e. equates to an area of the coma reflecting the same amount of sunlight as the bare nucleus.
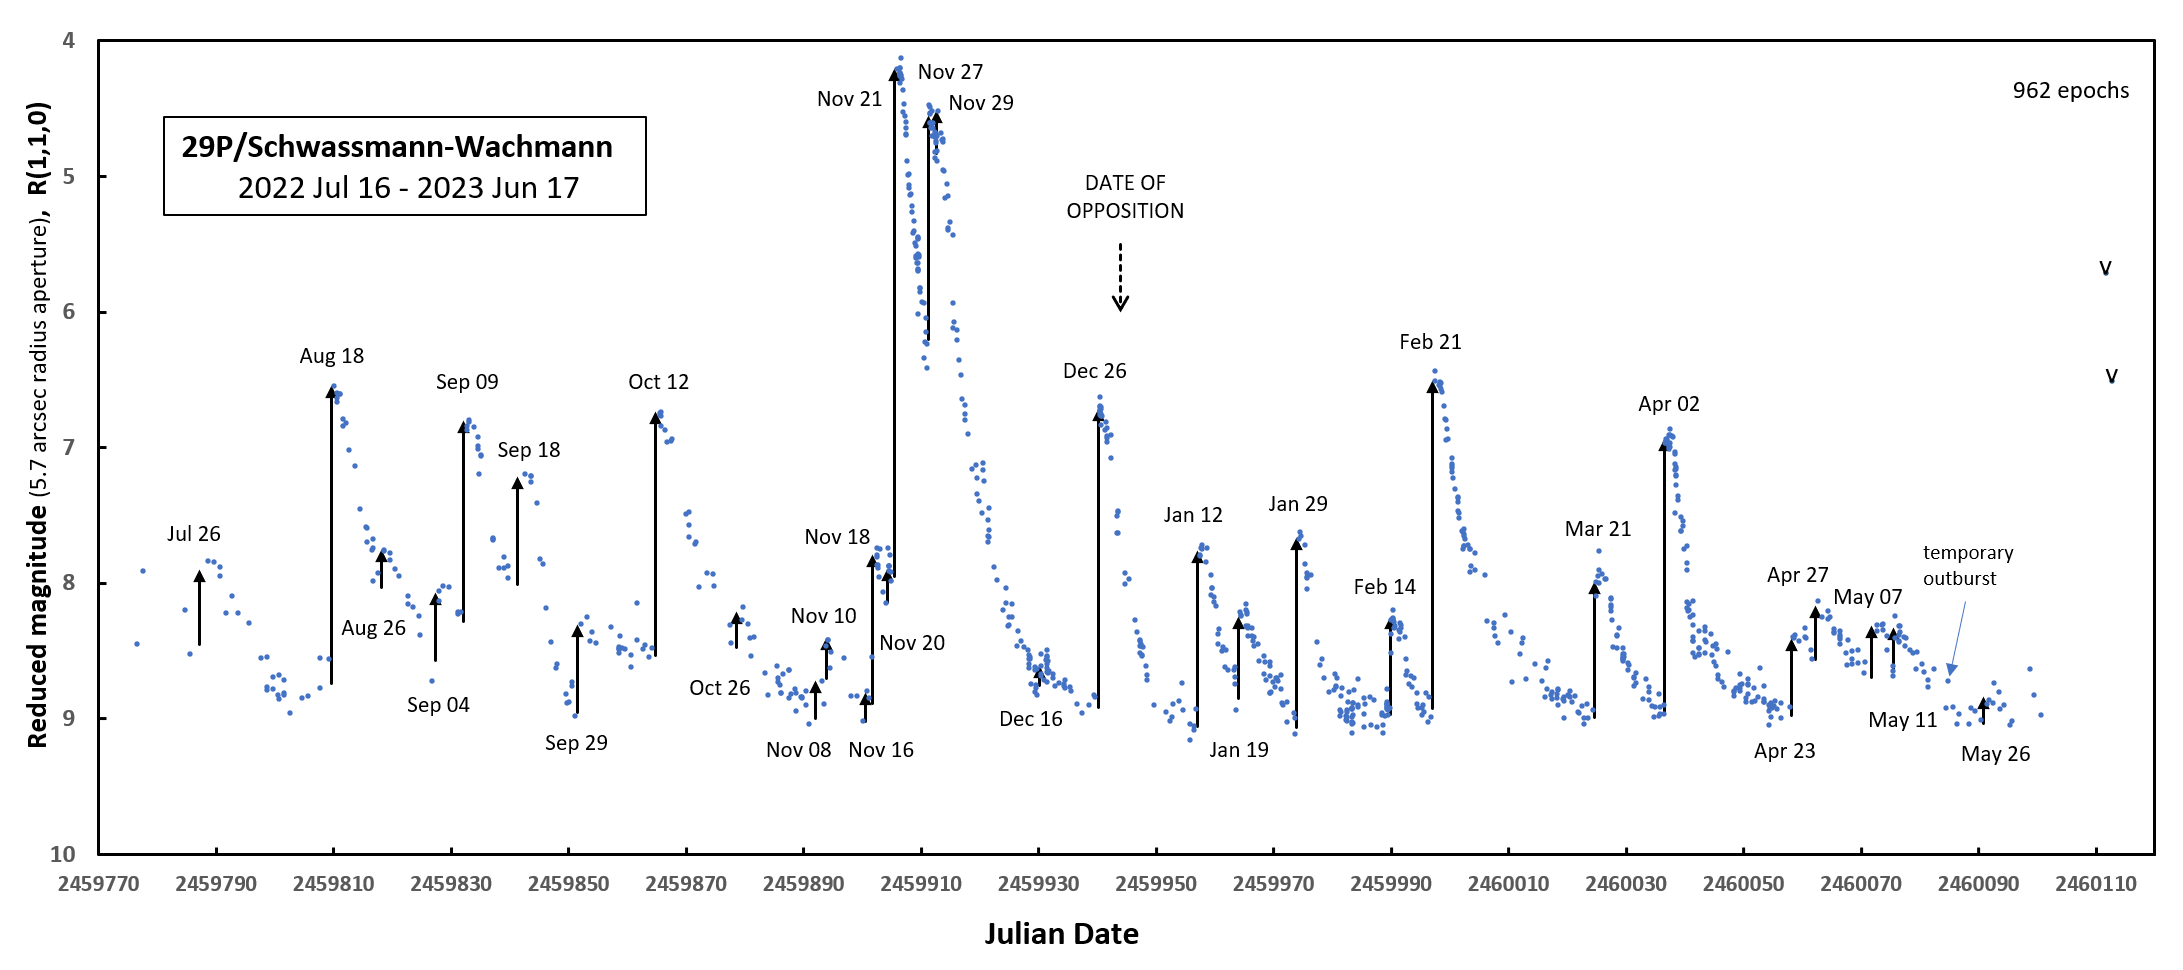
Figure 1: Lightcurve of the 2022‒2023 apparition of 29P showing the numerous outbursts detected
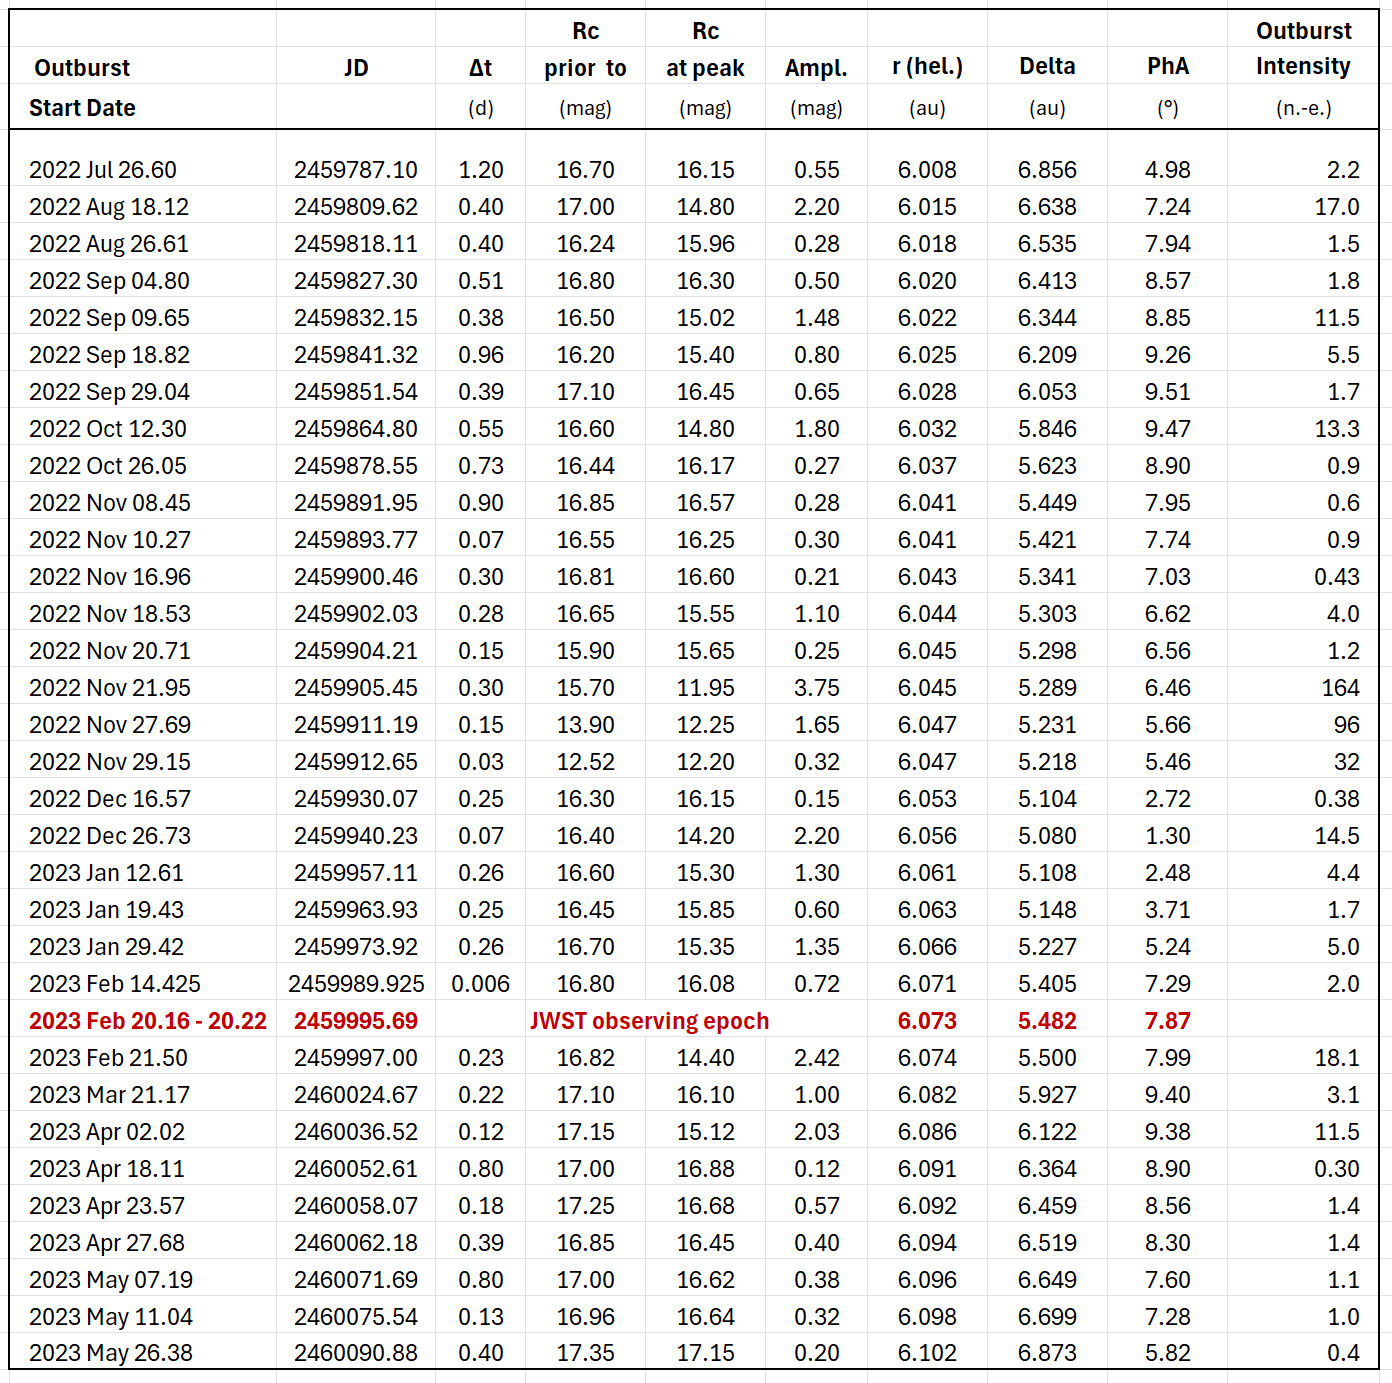
Table 1: Outburst summary data for the 2022‒2023 apparition of 29P
Prior to the JWST epoch, the nucleus had been relatively active ending with a mini-outburst (intensity = 2.0 n.-e.) on February 14, i.e. 5.6 days earlier. The inner coma then faded almost returning to its steady quiescence activity level close to R(1,1,0) = 9.0 (as measured in the standard 5.7 arcsec radius photometric aperture) by the time that JWST observed (see plot in Figure 2). The timing of the JWST observing epoch is important as virtually all of the gas and dust ejected by the eruption of February 14 would have travelled beyond the field of view of the IFU instrument by February 20. Hence JWST characterised a quiescent nucleus by which its near steady-state coma is maintained by normal cometary activity leaking gas and dust in conventional jets. Note that the annual dust production from such quiescent activity is much less than what is released each year by its many outbursts. Our data show that dust from outbursts shows a seasonal variation and represents between 60‒95 % of total production.
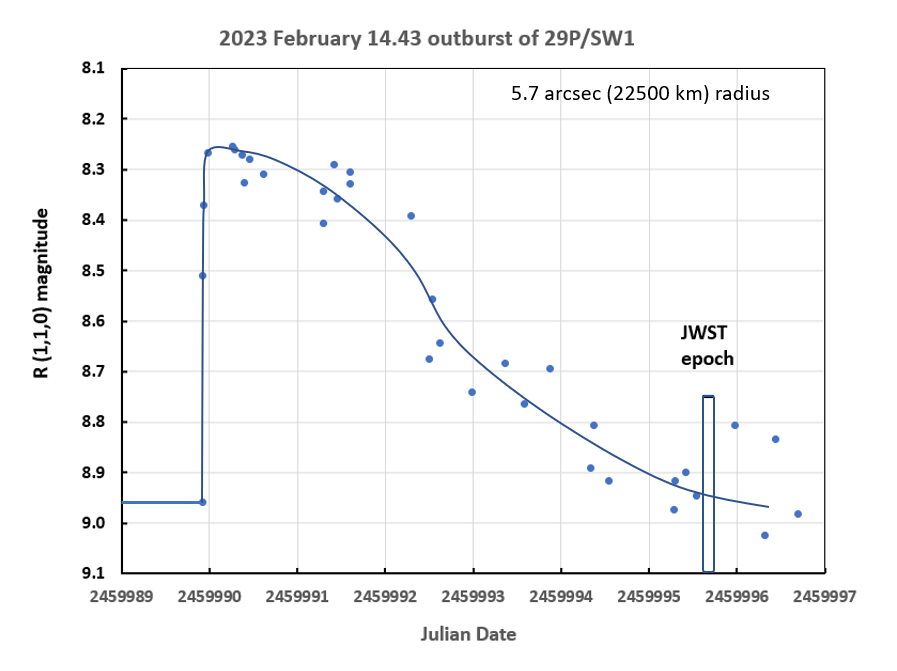
Figure 2: Lightcurve of the mini-outburst detected about 6 days before the JWST observing window.
Analysis of ground-based images contemporary with JWST
The cadence of our ground-based data was typically 3-6 observing epochs per day in the run-up to the JWST window. The latest data were obtained just 2.6 h before the IFU began observing confirming the nucleus to be quiescent at that time. We were fortunate to obtain six 60-sec SDSS-r 2.0-m Faulkes Telescope South images on 2023 02 20 11:32‒11:46 UT, i.e. 6‒8 h after the JWST epoch, which together with two similar 2.0-m images taken on 2023 02 17 12:00‒12:02 UT, a three further sets of 1.0-m images from February 17, 18 and 19, means we can trace the development of the inner coma a few days before the JWST observations as well as a few hours later. This was done using multi-aperture photometry to measure the cumulative brightness of the coma with increasing aperture radius (Figure 3). A preliminary result that suggests a small eruption had indeed taken place between Feb 19.80 and Feb 20.49 whilst JWST observed between Feb 20.16 and Feb 20.22. Figure 3 below shows that in the standard (5.7″ radius) aperture the flux was similar between these dates but extrapolating the coma profile to zero radius showed that close to the nucleus the flux may have increased by about 10%.
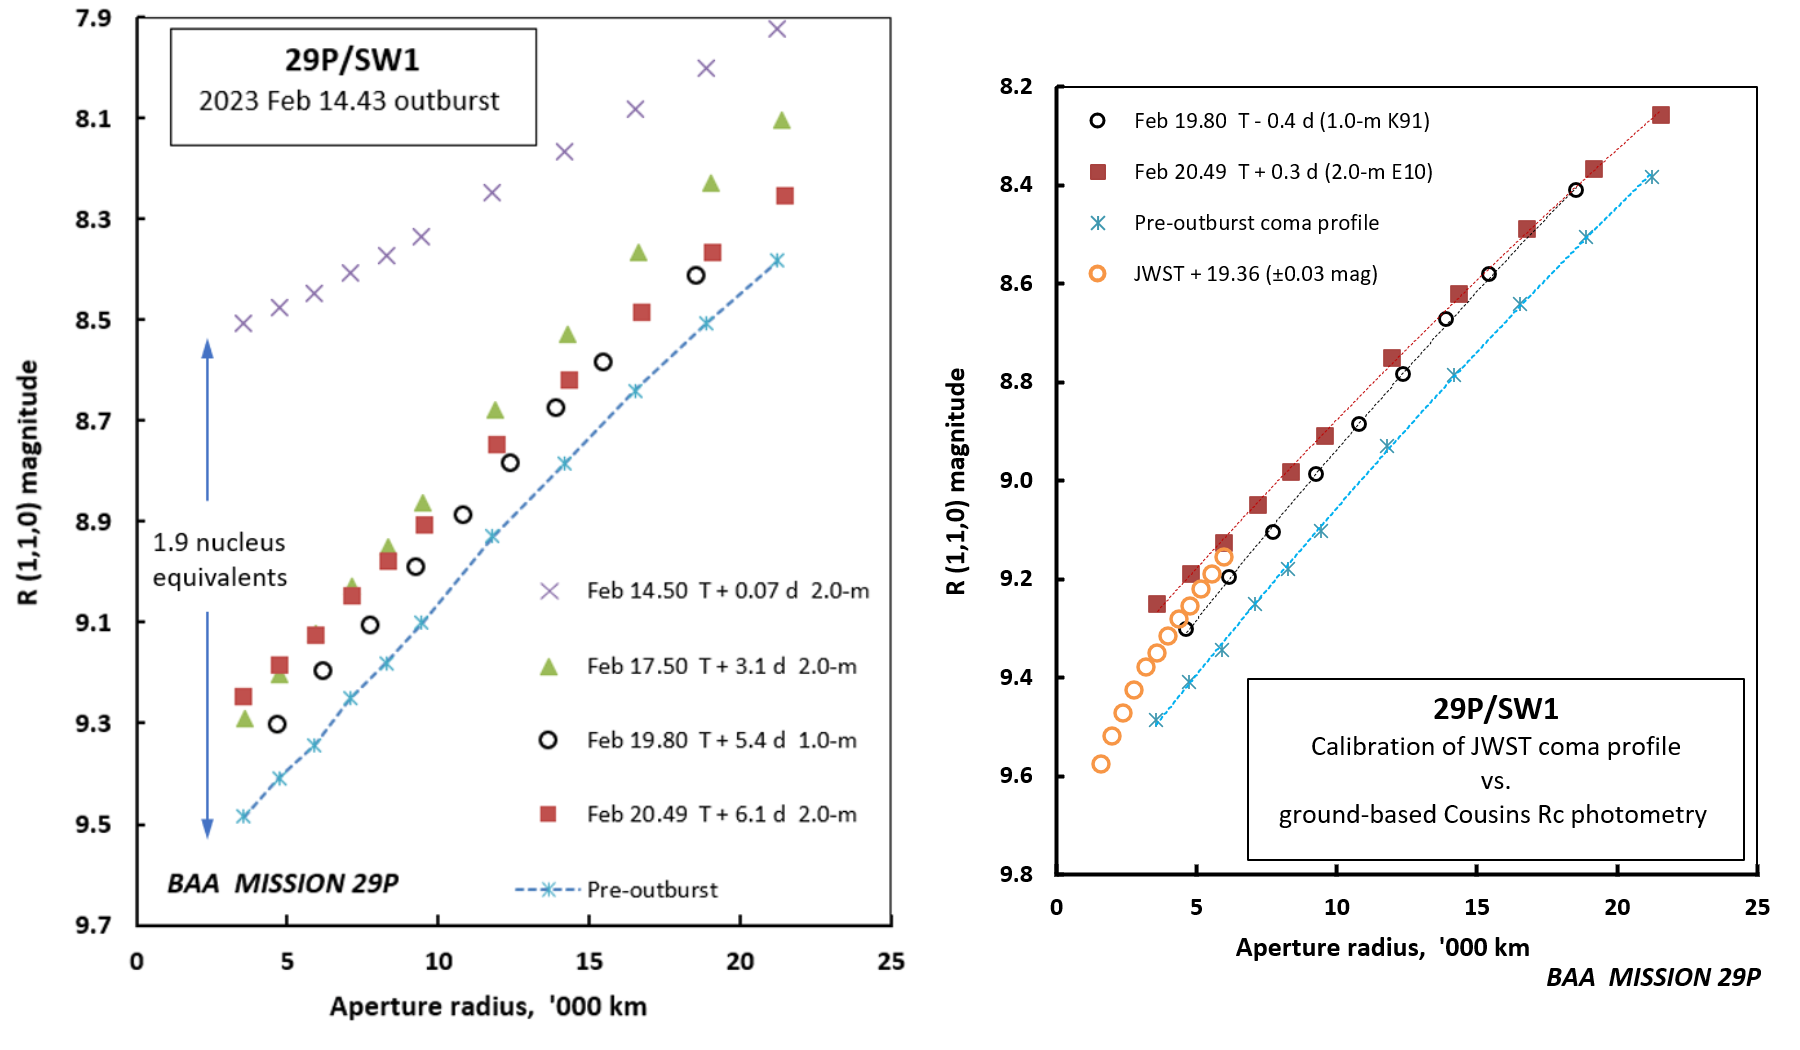
Figure 3: (left) Coma profiles from absolute photometry of SDSS-r filter images obtained using the Las Cumbres Observatory 1.0- and 2.0-m telescopes; (right) Calibration of JWST coma profile (centred on SDSS-r passband)
The first paper specifically on the 29P JWST observations has now been published. The article by Faggi et al. in Nature Astronomy is entitled, “Heterogeneous outgassing regions identified on active centaur 29P/Schwassmann–Wachmann 1” and examines and models the intensities of the infrared emission lines from CO and from CO2 gas detected across the IFU field of view, i.e. within some 4,000-4,500 km of the nucleus. The findings were summarised in the abstract as follows:
“We identified localized jets with heterogeneous compositions driving the outgassing activity. We employed the NIRSpec mapping spectrometer to study the fluorescence emissions of CO and obtain a definitive detection of CO2 for this target. The exquisite sensitivity of the instrument also enabled carbon and oxygen isotopic signatures to be probed. Molecular maps reveal complex outgassing distributions, such as jets and anisotropic morphology, which indicate that 29P’s nucleus is dominated by active regions with heterogeneous compositions. These distributions could reflect that it has a bilobate structure with compositionally distinct components or that strong differential erosion takes place on the nucleus.”
The most significant feature was a strong asymmetric jet of CO gas, the shape of which was suggestive of a jet having an opening angle of 60° extending over 5,000 km from the nucleus and centred on p.a. 20° projected on the sky (see righthand of Figure 4 below). The modelling indicated the source lay about 15° azimuth, i.e. fairly close to the local terminator, and at a latitude of +70°. The data from the Las Cumbres Observatory 1.0-m and 2.0-m telescopes showing the 10-15% flux increase in Figure 3 above is probably associated with the dust entrained by this CO outflow. The ensuing strong outburst about 30 hours after the JWST epoch saw the brightness of the pseudonucleus increase by about 18 times that of the bare nucleus visible as an asymmetric outburst coma 2 days later as shown in Figure 4 (lefthand image). This new outflow appears centred at p.a. 110° projected on the sky, which when compared to the JWST images of CO and CO2 gas emission patterns, corresponds to a well-sealed region of the crust devoid of significant gas release even though solar insolation would have been increasing rapidly as the sun rose over that area of the nucleus. This finding may be the first of its kind to show that a strong outburst has arisen where gas escape through the crust on the daytime side was efficiently blocked. Effective sealing of the crust inevitably results in a pressure rise beneath which gases can condense to form a fluid cryomagma rich in dissolved CO and other gases.
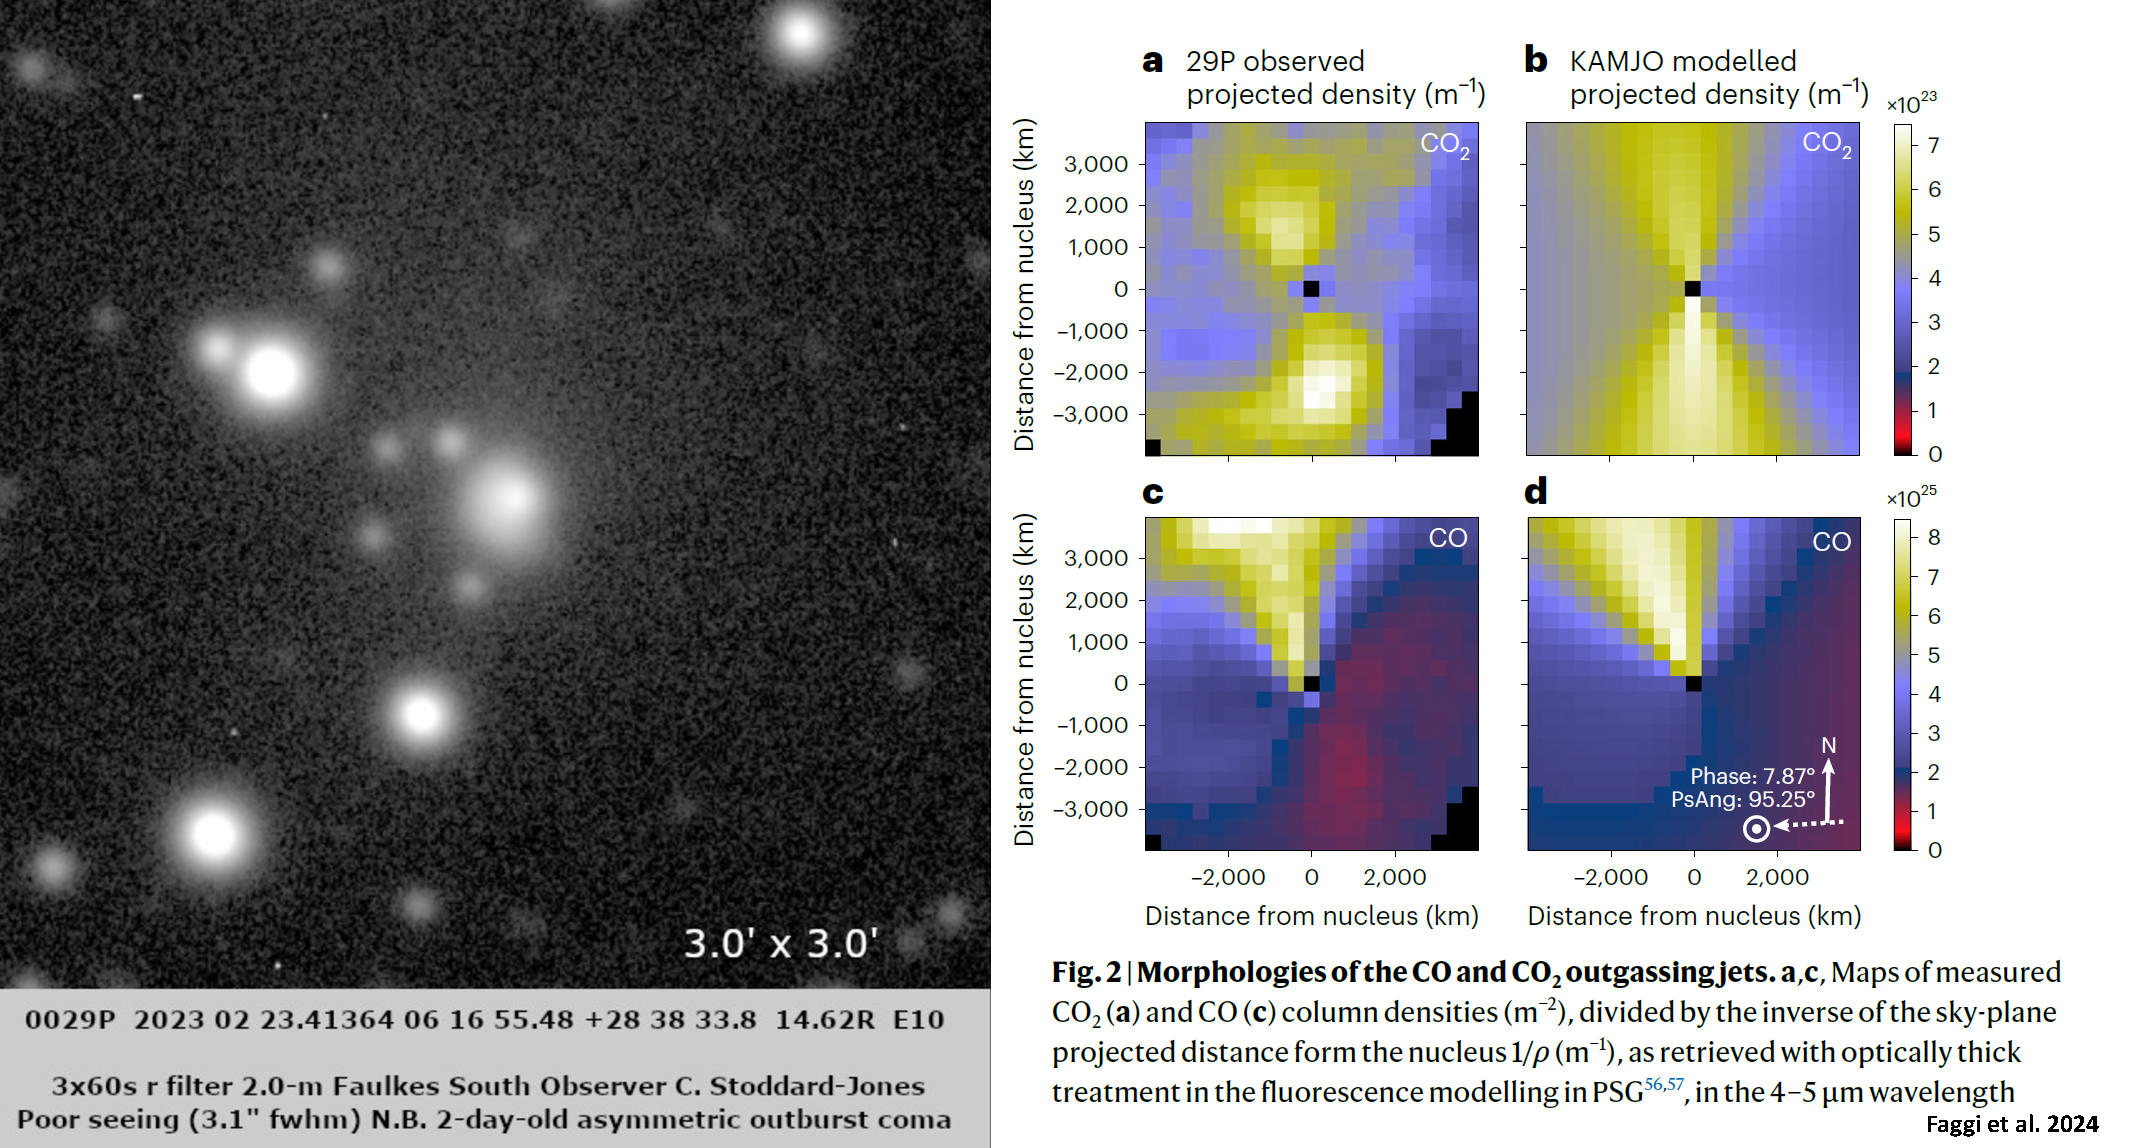
Figure 4: New strong outburst imaged 3.2 days after JWST observations shown on the left; the right image shows the measured CO density (inset c) normalised for distance from the nucleus
The well-sealed crust ultimately led to the subsequent eruption. Under pressure, the three-phase cryomagma is a mixture of simple alkanes and dissolved CO and N2 gas: the higher the pressure, the greater the proportion of dissolved gas. Where a fissure forms, cryomagma is ejected into space and the eruption is more intense owing to the near-explosive ‘exsolution’ of dissolved gases. Gas-loaded cryomagma may explain particularly strong outbursts. In contrast, weak mini-outbursts may correspond to eruptions of largely gas-free cryomagma in which only the liquid fraction boils vigorously creating a fountain of ejecta. Both gas exsolution and boiling of the liquid phase are highly endothermic physical processes that drain heat (enthalpy) from the cryomagma causing it to freeze, quenching any further activity. This conjecture can account for the short-lived nature of the eruptions, which last of the order of 10 minutes or so.
29P’s outbursts are largely CO-driven and do not seem to emanate from the northern or southern regions of the nucleus but show a strong preference for expansion diverging either side of the ecliptic plane, which indicates they are triggered by solar heating. One model to explain the JWST data alongside our data is that equatorial regions receive the most insolation and so diurnal thermal cycling is maximised favouring the formation of a crust of low porosity. Parts of the nucleus that experience little solar heating appear to have a porous crust. Chemically CO2 is hydrophilic in nature and has much more affinity to mix with H2O, methanol, etc. The symmetric north-south escape of CO2 gas in the JWST images strongly suggests there is a large compositional difference chemically speaking, compared with the CO-dominated middle region. Faagi et al. (2024) in their article also interpreted this as a dichotomy in the structural composition of 29P’s nucleus.
Analysis of JWST spectral image slices
Aperture photometry of JWST’s 0.0050-micron bandwidth image slices was carried out using Salsa J software centred on pixel (29,29) using apertures from 2 to 15 pixels radius. Examples of the typical coma profiles obtained towards the visible spectrum are shown in Figure 5 below. Each image analysed was a mean of 16 spectral slices. Below 4-pixels (o.4 arcsec) radius, the integrated flux was reduced by the point spread function of the telescope but above this radius the coma profile was essentially linear with aperture radius up to 6000 km. The insets to the coma profile plot show a typical JWST image slice alongside a stacked 6x60s SDSS-r image obtained with the 2.0-m Faulkes Telescope South. It will be possible to calibrate the JWST profile obtained using a stack of 7 spectral image slices from 0.6025 to 0.6325 micron centred on the SDSS-r mid value of 0.6175 micron by comparing the profile with that obtained using the 2.0-m ground-based images. In this way we can put the dust contribution in the JWST data on an absolute photometric scale and thus estimate the dust characteristics. Since JWST measured the mass of CO and CO2 gas within 5000 km of the nucleus, an estimate of the corresponding dust-to-gas ratio should be possible. A separate section detailing this will be added below.
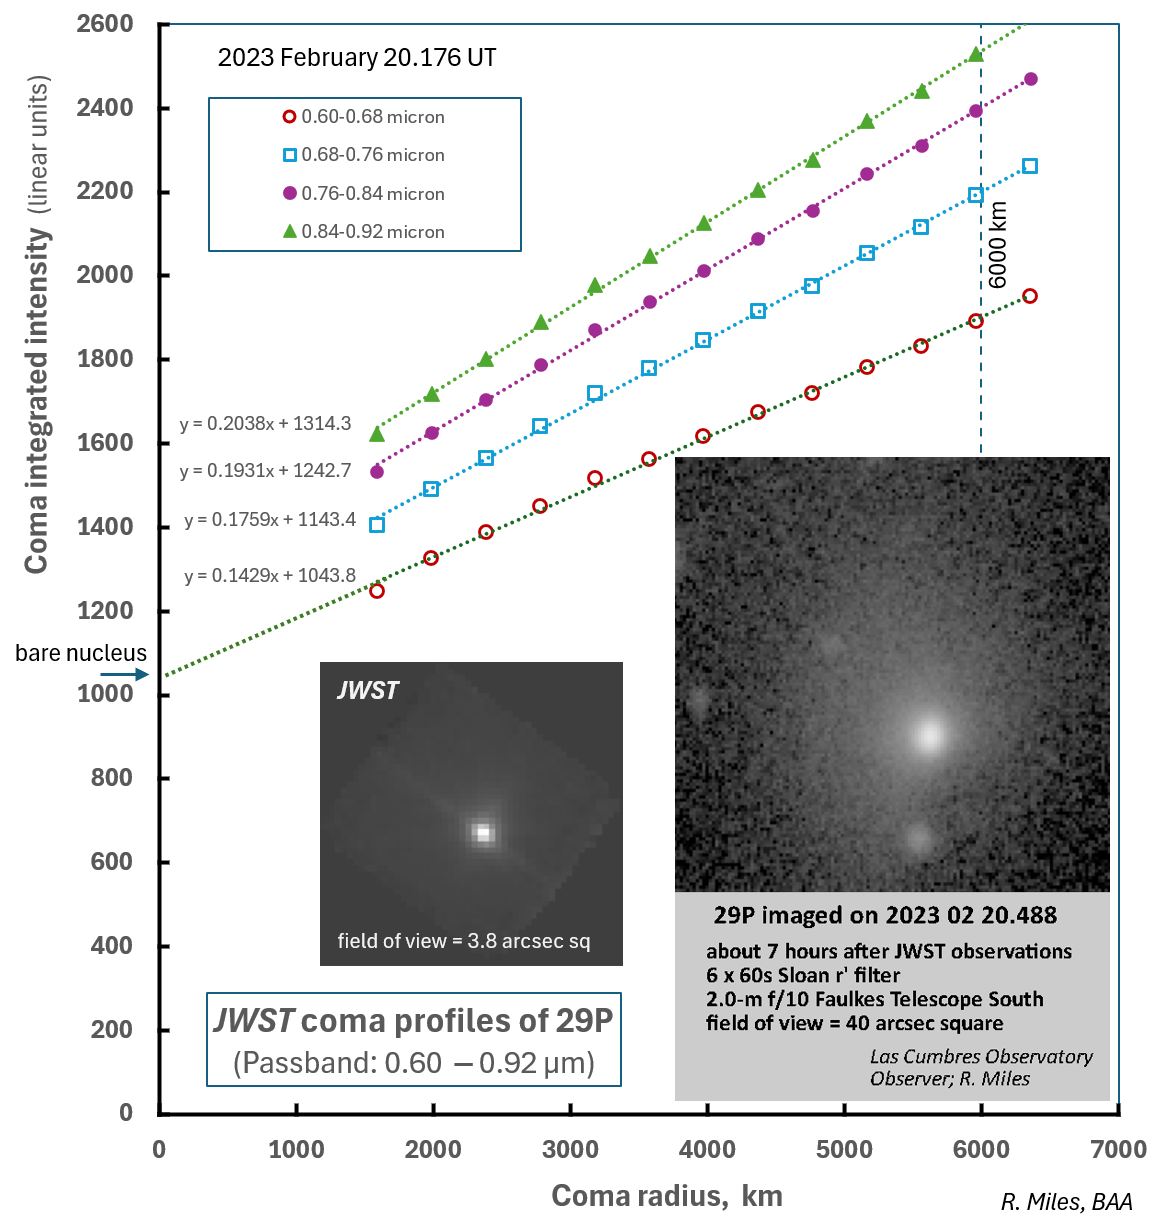
Figure 5: JWST coma profiles of stacked image slices in the visible and near-IR : insets compare a typical JWST in the visible with a similar passband ground-based image
Additionally, we can disect the nucleus and coma component of the integrated flux by linearly extrapolating the coma profile to zero radius limit. In this way, we derive spectra of the nucleus (intercept value) and the coma component (integrated flux at 6000 km radius minus the nucleus component). Figure 6 shows the derived spectra of the nucleus and coma with that of the nucleus having had a linear detrending function applied such that the two spectra are normalised to be of more or less the same intensity across most of this spectral range.
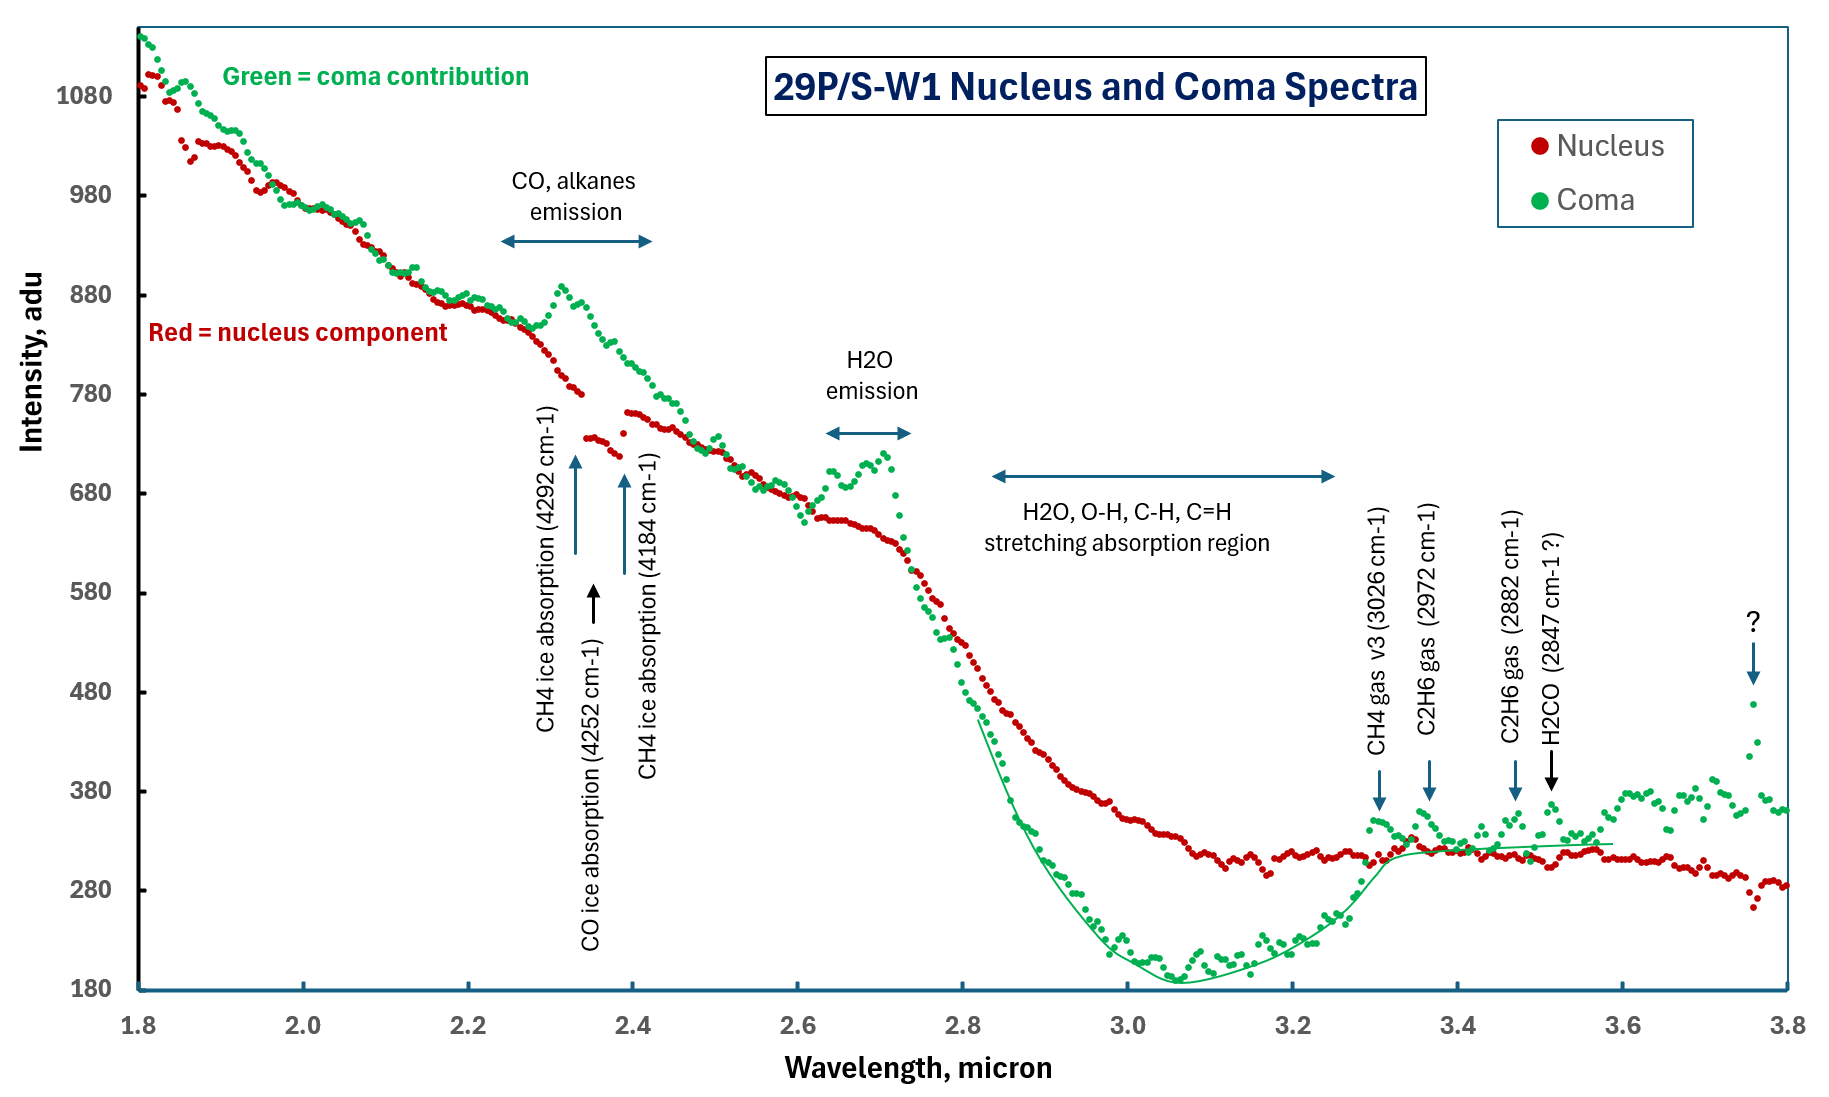
Figure 6: Derived spectra of the nucleus and coma components
Tentative assignments have been made for some spectral features. Note that there are many more emission features from gaseous molecules than there are absorption bands associated with the surface of the nucleus. Methane (CH4) and ethane (C2H6) gas is evident in the coma for instance. It is not possible to reliably identify discrete features in the broad absorption spanning 2.80 ‒ 3.25 micron as this is a summation of many different molecules except to say that the this broad feature is about twice as prominent in the coma than for the nucleus. Probably the most similar broad feature to this is that for the centaur (2060) Chiron, where apart from strong CO2 absorptions at 2.70 and 2.77 micron (the surface of Chiron is dominated by CO2), this particular spectral range was seen to be featureless in the JWST data (Pinilla-Alonso et al. 2024). In the case of 29P, CO2 is present in the coma at about 1% of the intrinsic abundance of CO but is not seen in absorption, partly because the strong CO2 emission from the coma obscures any surface absorption features present.
Probably the most unusual feature is the sharp-edged absorption band between 2.33 ‒ 2.38 micron close to the centre of a broader complex emission band around 2.29 ‒ 2.46 micron, shown more clearly below. The width of the absorption band is 0.055 micron. Two characteristic CH4 bands measured on CH4 ice at 10 K occur at 2.326 and 2.380 micron (Gerakines, Bray, Davis and Richey, Astrophys. J., 2005, 620, pp.1140-1150), which differ by 0.054 micron, i.e. very similar. The shift to longer wavelength is close to 0.011 micron and this increase is due to the ice being warmer than 10K — most probably in the range, 40-60K when compared to the thermal expansion coefficient of solid methane (A.V. Leont’eva et al., J. Exptl. Physics 2014, Issue 1 / 127050).
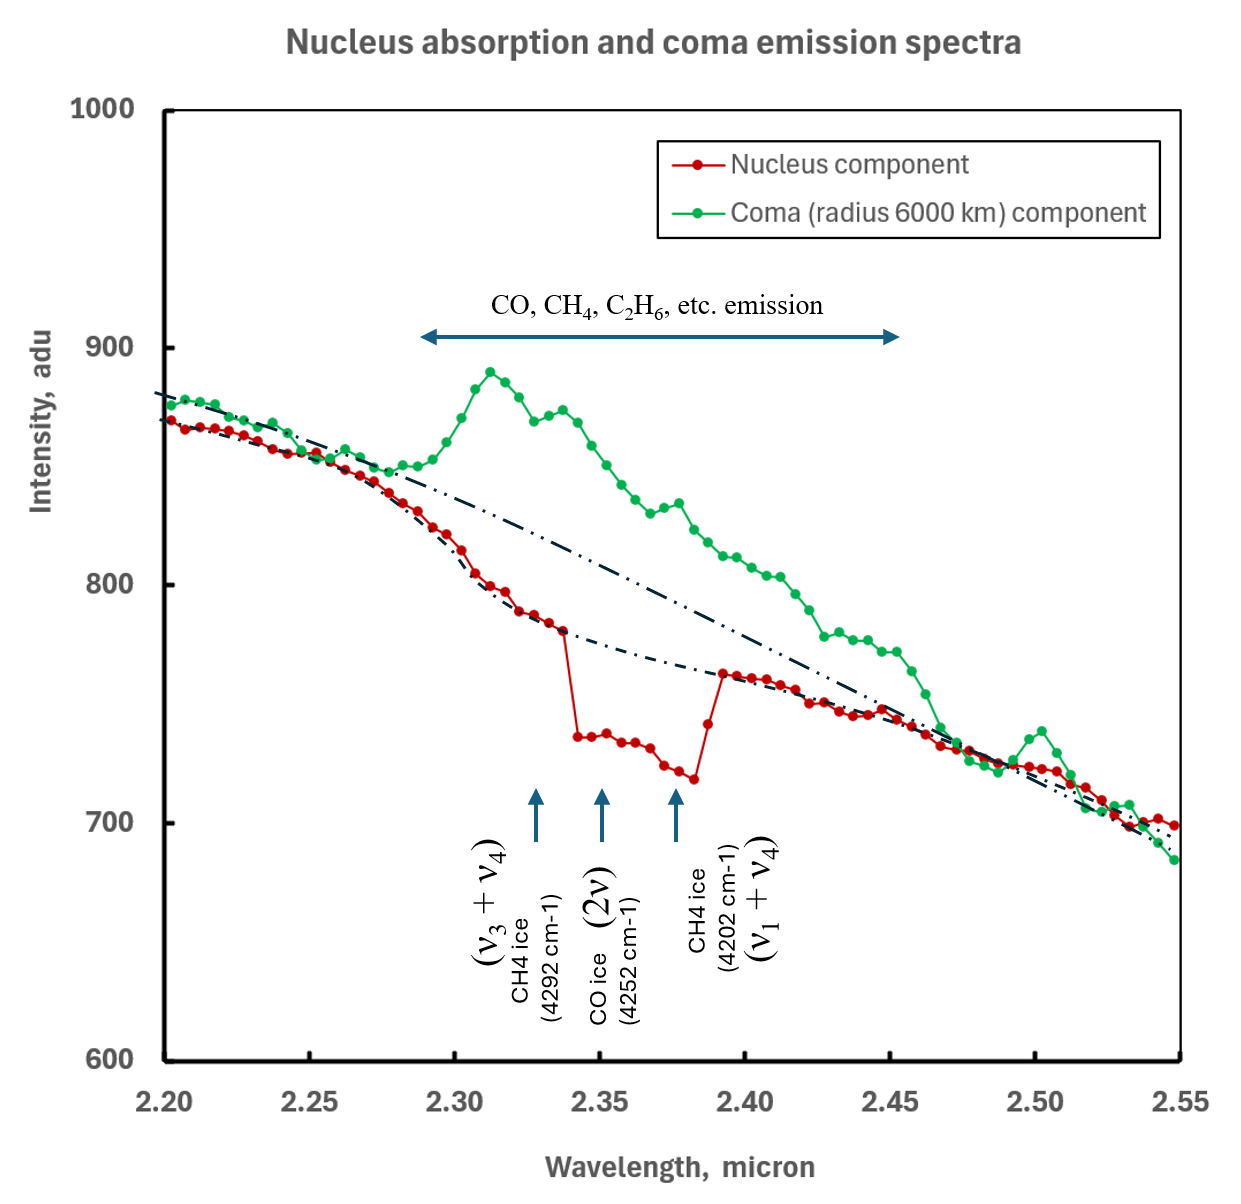
Figure 7: Expanded view of the absorption feature at 2.33 ‒ 2.38 micron
The most probable explanation of this feature is that it is a solid solution of CO in a mix of linear alkanes, mostly methane, ethane and some propane at temperatures of 50‒70 K. Wavelengths corresponding to combinations of symmetric C‒H stretching vibrations are shown for pure CH4 ice at 10 K and the first harmonic stretching vibration at 2.352 micron for pure CO ice (Gerakines et al., Ap. J., 2005). A solid solution of CO in linear alkanes would lead to molecular C‒H and C=O interactions broadening these three bands to produce the observed feature with steep sides shifted slightly to longer wavelength. Miles (2016) in an article entitled, “Heat of solution: a new source of thermal energy in the subsurface of cometary nuclei and the gas ex-solution mechanism driving outbursts of comet 29P/Schwassmann-Wachmann and other comets” detailed the different chemistry that would produce a strong surface crust trapping liquid solutions of CO (and N2)and predominantly hydrophobic C1‒C3 hydrocarbon mixture in comets beyond the snowline. This cryomagma is stable provide it stays pressurised (~10 kPa) but if a fissure forms in the overlying crust or the pressure on the daytime side rises until it exceeds the strength of the crust, the sudden loss in pressure results in exsolution of the dissolved CO creating an expanding foaming mixture of solid particles and fine gas bubbles that would form a temporary fountain projecting into the vacuum of space. Exsolution is an highly endothermic physical reaction that drains heat from the cryomagma causing it to refreeze near the immediate surface forming a volcanic plug and resulting in a rapid shutdown of the cryo-eruption. The discovery of icy surface material containing CO, CH4 and other hydrocarbons in the JWST spectral data is strong evidence that regions of the nucleus (probably those close to the morning terminator) are rich in this material supporting the proposed mechanism. After the eruption, solar heating would tend to vaporise volatile species close to the surface and those coma particles travelling at less than escape velocity (~25 m/s) would precipitate across large areas of the nucleus forming an insulating layer. This fallback process over time and the very marked diurnal thermal cycling of the surface are important reasons why a strong crust has formed over time confining cryomagma under pressure.
Calibration of JWST spectral imaging based on Cousins-R photometry of the coma profile and nucleus from ground-based observations
Here the objective is to determine the absolute magnitude of 29P’s nucleus from JWST data. One aspect of MISSION 29P is to study changes in the coma profile during times when the nucleus is relatively quiescent or only subject to mini-outbursts. Sometimes we see a fraction of the inner coma disappear within a day or two of an eruption presumably from fallback of material onto the nucleus. But we are also able to extrapolate the profile to zero radius and thereby obtain a measure of the brightness of the nucleus alone, as was done to generate the above spectra. We are able to combine the February 20.488 ground-based 2.0-m photometry with JWST by linking the Cousins-R photometric profile with the JWST profile since the two overlapped between 3,600 km and 6,300 km radius as shown above in Figure 3 (right). On this scale, ground-based observations indicate the nucleus alone has an absolute R(1,1,0) magnitude of 9.77 ± 0.04, which is close to where the JWST profile meets the y-axis. Figure 8 depicts some data showing intercept values of the coma profile observed over the years using 2.0-m telescopes. Note that between 2014 and 2023 the value of R(1,1,0) varied by <0.25 mag, which must therefore represent an upper limit of the rotational lightcurve amplitude or seasonal changes in the aspect ratio of the nucleus. The photometry, as with recent occultation results (M.W. Buie et al., ACM Conference 2023 (2445.PDF)), counter the idea that 29P’s nucleus is bi-lobate in shape.
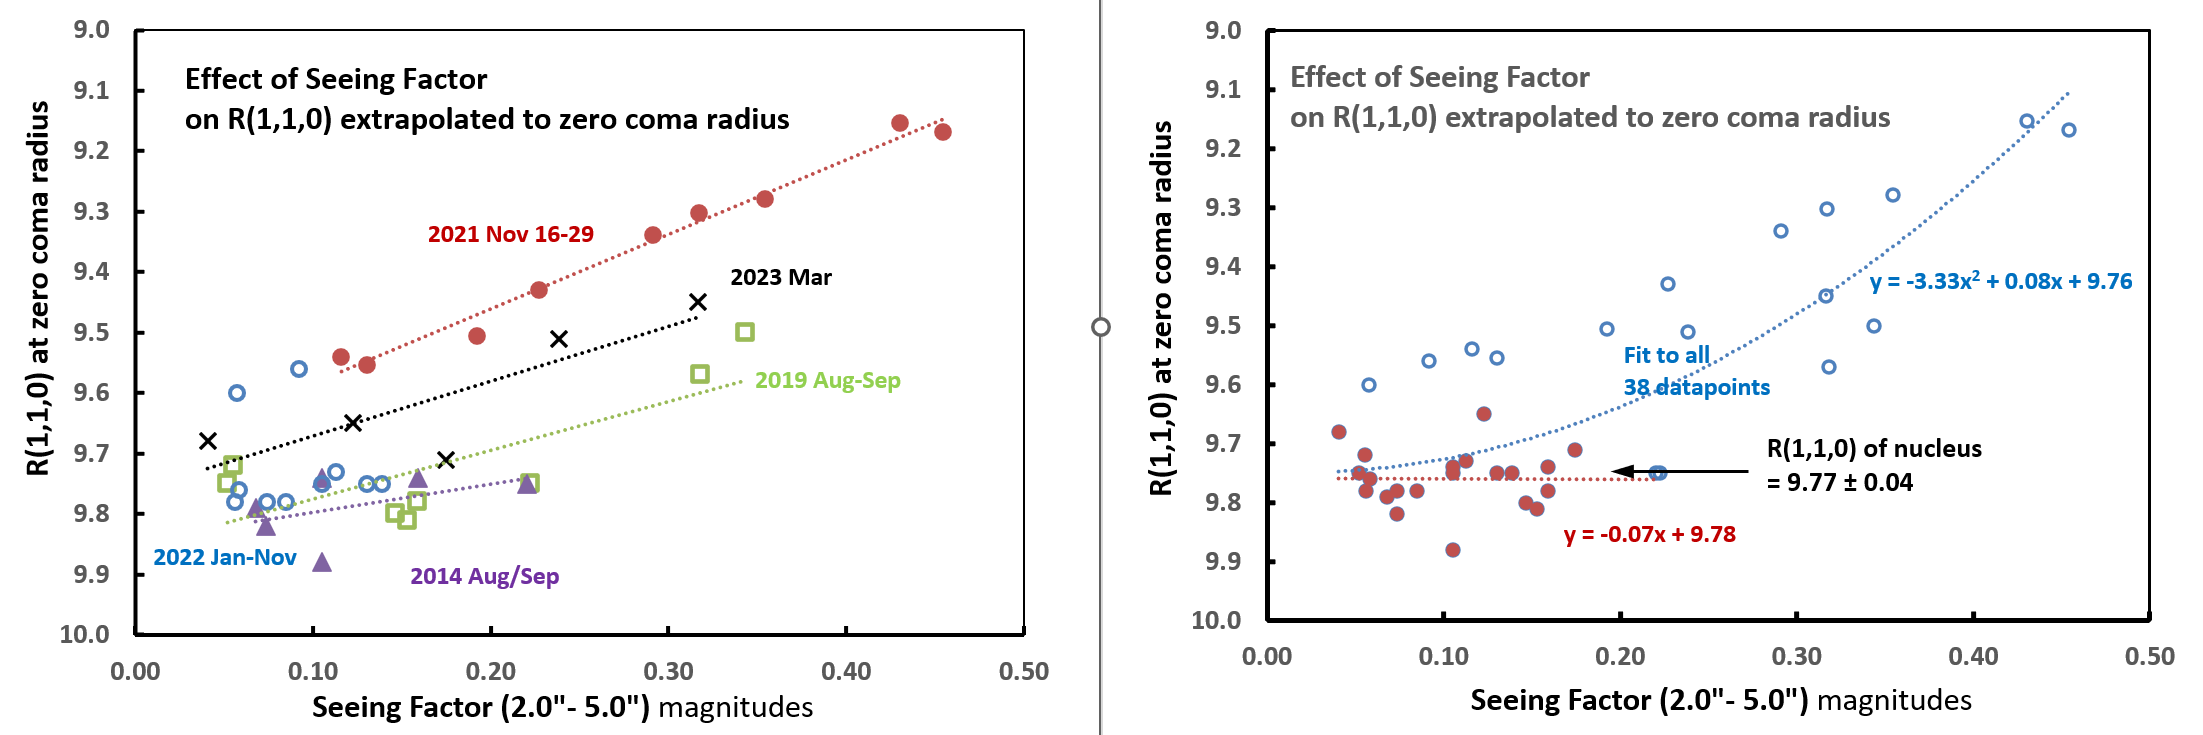
Figure 8: Derivation of the absolute magnitude of 29P’s nucleus corrected for seeing
The nucleus of 29P never becomes entirely dormant and this can be seen in Figure 8 that plots the zero radius extrapolated magnitude against Seeing Factor: a parameter defined as the difference in the zeropoint magnitude of stars measured with a 5.0 arcsec radius aperture compared to that measured with a 2.0 arcsec radius aperture. With the 2.0-m instruments in very good seeing, this difference can be as little as <0.05 mag. We may also expect some seasonal variation in the value of R(1,1,0) depending on the tilt of the spin axis and the shape of the nucleus although stellar occultation measurements suggest the shape is only mildly oblate.
Dust-to-(CO)gas mass ratio in the coma observed by JWST
The hypothesis postulated here is that 29P is characterised by sunlit regions of its nucleus having a relatively strong crust. CO-driven outbursts or jets necessarily eject material from beneath this crust. We can test the proportion of dust entrained in escaping gas by dividing an image from the spectral range dominated by reflected sunlight from dust by an image of the spectral range dominated by emission from CO gas. This can be seen in Figure 8 (right) below.
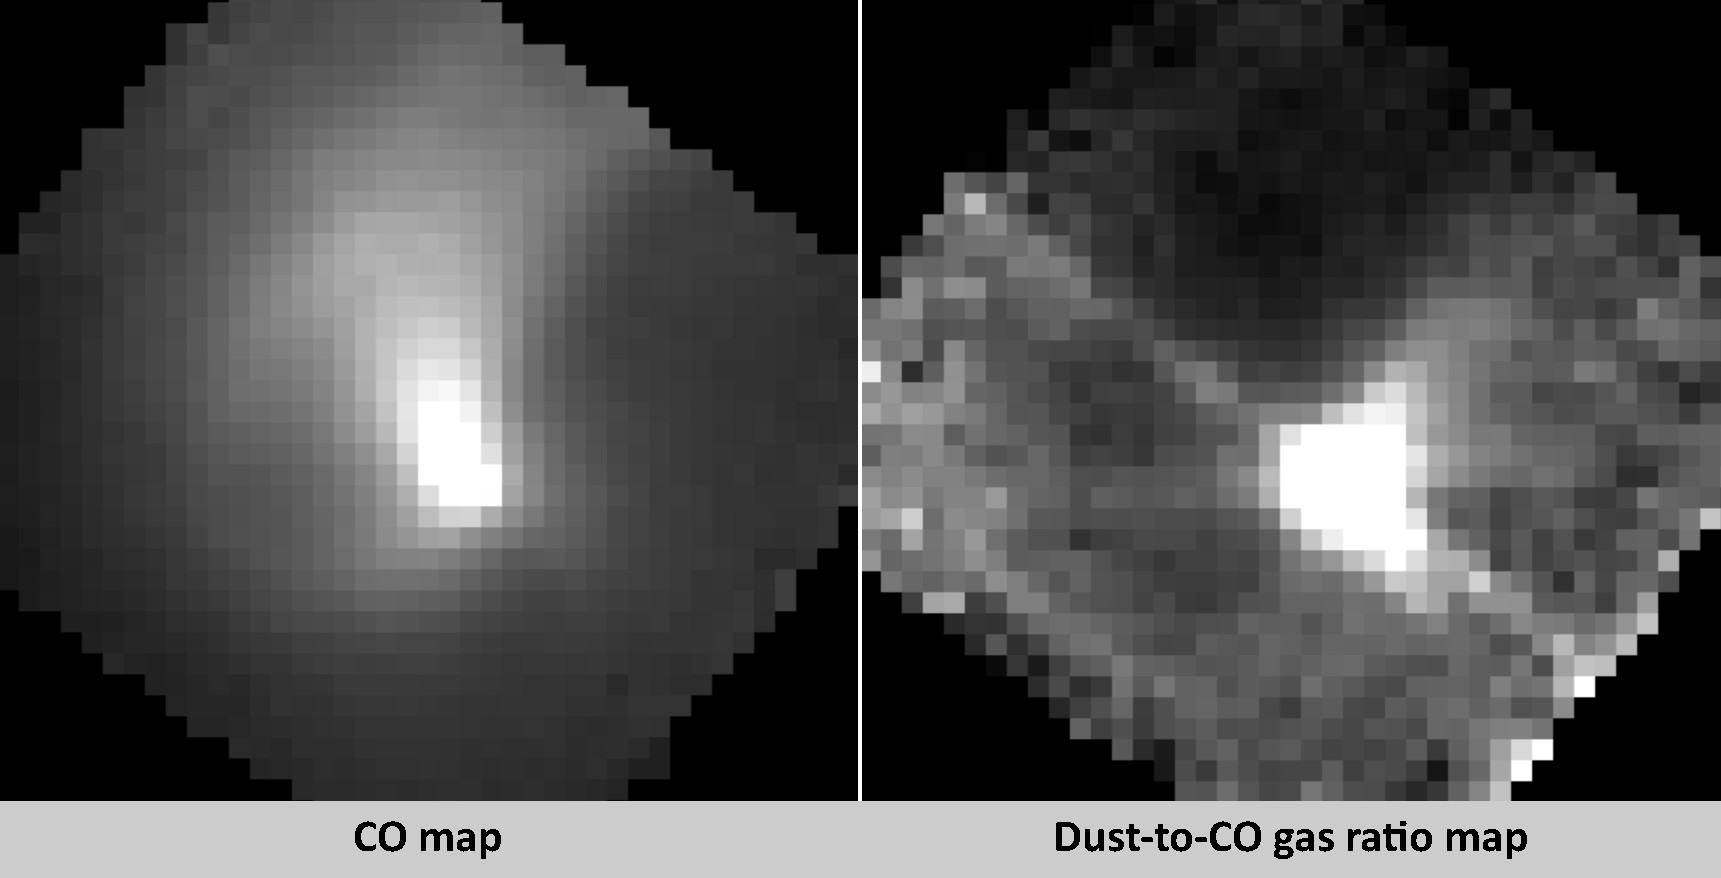
Figure 9: (left) Stack of 3 image slices (4.680 ‒ 4.695 micron) showing CO gas distribution; (right) Ratio of reflected light from dust (0.60 ‒ 0.76 micron) to CO gas
The dark quadrant in the righthand image shows that the CO jet in the direction p.a. 20°± 30° is significantly depleted in dust. So relatively little dust is entrained in the escaping CO gas indicative of a strong crust in that region of the nucleus.
Note the diffraction artifact in the ratio map orientated parallel to one side of the frame: this is caused by diffraction effects in the optical train of the telescope. The bright nucleus, the area of which subtends only about 2% of the area of a pixel, behaves rather like a point of light and so is subject to diffraction. The dust comprising the extended coma is much fainter whilst the CO emission is from a very extended source in the coma. From the paper by Faggi et al. (2024) we can calculate the column density of CO gas in each pixel of the CO map. Knowing the absolute Rc magnitude of the nucleus and the integrated flux in the coma as a function of distance from the nucleus, we can derive the absolute dust-to-gas mass ratio for each pixel position assuming dust grains of a particular size. Although the particle size distribution is broad, cometary comae are typically modelled on the basis of a mean particle radius of 1 micron radius and a typical density of 500 kg/m^3. For a normal Jupiter-family comet such as 67P/Churyumov-Gerasimenko, the value of this ratio is about 0.5 ‒ 1.0 (M. Pätzold et al., Mon. Not. R. Astron. Soc. 483(2), 2337–2346 (2019)). The extreme dust-to-gas mass ratio in comets varies from about 0.1 to 10.
Here we analysed the cumulative intensity of the (coma + nucleus) in a stack of 7 spectral slices in the range 0.6025‒0.6325 micron centred on the middle of the SDSS-r bandpass. as shown plotted in Figure 3 (right) as a function of coma radius and which has been calibrated absolutely against stars in the ground-based 2.0-m images. The diffraction of light from the nucleus (see Figure 9, right) transfers some flux from the nucleus into the outer coma, adding to the curvature of the JWST coma profile as shown in Figure 3, right. We calculated the intensity of circular annuli of 1 pixel width ranging in radius from 3.5 pixels to 10.5 pixels centred on the nucleus. The size of each JWST pixel projected on the sky equals 397.55 km. The absolute magnitude of particles was derived using the formula of Fowler and Chillemi (Equation 24, p.38 from Fowler, J.W., Chillemi, J.R., 1992. IRAS asteroid data processing. In: Tedesco, E.F. (Ed.), The IRAS Minor Planet Survey. Tech. Rep. PL-TR-92-2049. Phillips Laboratory, Hanscom Air Force Base, Massachusetts, USA, pp. 17–43). The formula is;
| r(km) = 0.5*10^[3.1236-0.2*H-0.5*log(Albedo)] … Eqn. (1) |
Conversion from the Johnson V system to Cousins R employed the colour index, V‒R = +0.38, and a geometric albedo of 0.042. Using this equation, the R(1,1,0) magnitude of 9.77 equates to a nucleus radius of 30.3 km.
The cumulative reflective area of the coma (assuming 1-micron radius spherical particles having the same albedo as the nucleus) was calculated as a function of radius. Using Equation (1), we also calculate the mass of 1-micron radius particles that reflect 1 nucleus-equivalent of sunlight to equal 1.91 x 10^6 kg, adopting a mean coma particle density of 500 kg/m^3. We calculate the mass of dust in apertures (projected on the sky) increasing in steps of 1 pixel radius. From this we can determine the mean mass of dust in each concentric annulus. Although this is a 360° average, we separately analysed the pseudo-SDSS-r image (shown in Figure 10 below) in terms of the average coma intensity of a 5-pixel radius aperture in the four quadrant directions centred 13 pixels from the nucleus and found these to be in the relative ratios: North 88%; West 136%; South 113% and East 63%. From these we were able to adjust the relative dust quantities in each quadrant direction.

Figure 10: Stack of 7 image slices (0.6025 ‒ 0.6325 micron) centred on the SDSS-r bandpass
To determine the mass of CO gas in each pixel, we employed the absolute calibration of Faggi et al. (2024) shown in Figure 4 above, converting to molecules per m^2 by dividing by the mean radial distance of each annulus in metres. From those values, the mass of CO per unit area was calculated by dividing by Avogadro’s Number to convert from number of CO molecules to units of molar mass (28 g) and then to kg by dividing by (1000/28). Table 2 summarises our findings below.

Table 2: Comparison of dust-to-CO-gas mass ratio in the main CO outflow compared with the coma in the opposite direction
The last line of the table shows that the normal quiescent coma 2,200 km south of the nucleus exhibits a dust-to-CO-gas mass ratio of 0.12, which is comparable to that of the more gassy comets. It should be noted that we only consider the CO mass fraction of gas whereas this outflow is also likely to contain other gases such as nitrogen and alkanes that may lower the mass ratio by a further 10‒20%. In contrast, the outflow in the northern direction, though about 14% depleted in dust compared to the 360°-average dust composition within the coma, has an unusually low dust-to-CO-gas mass ratio almost 10 times less than the quiescent dust coma. The dust-to-CO ratios listed in Table 2 range from 0.008 to 0.014, which values must be upper limits as some of the dust reflecting sunlight in the line of sight will lie in front of and behind any localised CO outflow. The very low dust-to-CO ratio is evident in the dust-to-gas ratioed image shown in Figure 9, right. Faggi et al. (2024) describe this region as comprising an outgassing CO jet and our results show the extra gas flow in this region entrains a much smaller fraction of solid ejecta than in the quiescent coma, indicative of a consolidated crust at the nucleus.
The strong outburst about 30 hours after the JWST epoch created a dust cloud that reflected 18 times more sunlight than the bare nucleus, yet little if any CO gas was seen to escape west of the nucleus, we conclude that the subsurface in this region was held under sufficient pressure to trap cryomagma rich in a gas/liquid fraction.
Discussion
Previous evidence has shown that during 2010‒2014 strong outbursts were correlated with a 57.7-d periodicity, presumed to correspond to the nucleus’ axial rotation period. For such a slow rotator, large areas of the surface would radiate heat to space when hidden from the Sun for several weeks, cooling to temperatures below 20 K. This cooling phase would inevitably solidify cryomagma near the surface further sealing the crust such that the region close to the morning terminator on the nucleus may have a significant amount of exposed CO ice at the surface, that begins to sublimate. Some of the absorption features in the spectra shown in Figures 6 and 7 may arise from such temporary ices near the morning terminator but which gradually sublimate as these regions of the nucleus rotate further into sunlight. Faggi et al. (2024) also detected CO2 outflows from the northern and southern extremities of the nucleus as shown in Insets ‘a’ and ‘b’ of Figure 4, right. Solid CO2 ice does not form stable solid ice mixture with CO, N2 or CH4 and other simple alkanes. Furthermore its triple point pressure is very high (517 kPa), too high to exist in the liquid phase within a comet nucleus and so over long times enthalpy heating of the interior has differentiated the nucleus such that cryomagma has formed and preferentially migrated to areas closer to the ecliptic plane direction where insolation is strongest. Also over long times, eruptions have preferentially occurred nearer to the morning terminator, the momentum transfer of which has gradually slowed its rotation rate such that now the very long day-night thermal cycling has also facilitated differentiation of the interior through enthalpy transfer by sublimating gases transported by local pressure gradients. Differentiation is possible in this way in a nucleus rich in volatile ices. The overall effect leaves the northern and southern extremities rich in CO2 ice, the vapour pressure of which around 100 K would be sufficient to maintain the observed outflows. This scenario contrasts with the modelling by Faggi et al. (2024) of a bilobed nucleus, although these authors do point out that the stark compositional difference could be the result of CO depletion from a polar region of a nucleus that has high obliquity.
Other reasons for its peculiarities include it being very large (~60 km) compared to most comets and that it occupies a metastable orbit trapped between Jupiter and Saturn, where close approaches in the past may have differentiated the object in some way. The comet we know of that is closest in composition to 29P is probably Comet C/2016 R2 (PanSTARRS), which has a peculiar CO-dominated volatiles composition and reached perihelion in 2018 some 2.60 au from the Sun on a near-parabolic orbit (McKay et al. 2019). The extremely low dust-to-gas mass ratio reported here likely similar to C/2016 R2, Biver et al. 2018 concluding that its dust production lower than values measured in comets of similar gaseous activity at ~3 AU from Sun by more than a factor of 15. In addition, C/2016 R2 is much smaller in size and has not been subjected to the more complex thermal history experienced by 29P.
Acknowledgements
MISSION 29P has amassed high-cadence photometry and morphology of 29P’s outbursts since 2014 March thanks to not only the many amateur astronomers who have contributed observations over the years but also to the access to the Las Cumbres Observatory network of telescopes (LCOGT) and in particular the two 2.0-m Faulkes Telescopes located at Haleakala, Hawaii and Siding Spring, Australia (see “Las Cumbres Observatory Global Telescope Network”, Brown, T. M. et al., Publications of the Astronomical Society of the Pacific, 2013, Volume 125, issue 931, pp.1031-1055). During the 2022‒2023 apparition, 41 observers and 52 observatories contributed data.
A full list of 2022‒2023 observers, observatories and telescopes follows:
186 A. Novichonok    Kitab Observatory, Uzbekistan    TEL 0.36-m f/8 Reflector,                no filter     5.14" (3pix)

D. Schmalz

204 L. Buzzi         Schiaparelli Observatory, Italy  TEL 0.84-m f/3.5 Newtonian reflector,    no filter,    5.58" (3pix)

204 A. Aletti        Schiaparelli Observatory, Italy  TEL 0.36-m f/7.5 Reflector,              Rc filter,    5.58" (6pix)

204 A. Aletti        Schiaparelli Observatory, Italy  TEL 0.20-m f/4.0 Reflector,              Rc filter,    4.92" (3pix)

213 R. Naves         Montcabre Observatory, Spain     TEL 0.30-m f/9 Schmidt-Cassegrain,       no filter,    5.40" (6pix)

718 P. Wiggins       Tooele, Utah, USA                TEL 0.36-m f/5.4 Schmidt-Cassegrain,     no filter,    5.11" (7pix)

941 J. Manteca       Segorbe, Spain                   TEL 0.40-m f/7.3 Schmidt-Cassegrain,     no filter,    5.07" (3pix)

970 N. James         Chelmsford, UK                   TEL 0.28-m f/10 Schmidt-Cassegrain,      no filter,    5.60" (5pix)

A77 F. Kugel         Dauban, France                   TEL 0.40-m f/2.8 Reflector,              no filter,    4.98" (6pix)

B96 E. Bryssinck     BRIXIIS Observatory, Belgium     TEL 0.4-m f/3.8 Reflector,               R, Clear      4.96" (4pix)

C10 J.-F. Soulier    Maisoncelles Observatory, France TEL 0.30-m f/3.8 Newtonian,              no filter,    4.65" (4pix)

C23 A. Diepvens      Olmen Observatory, Belgium       TEL 0.20-m f/9 Refractor,                Luminance     5.76" (3pix)

E10 Faulkes South    Siding Spring, Australia         TEL 2.00-m f/10 Ritchey-Chretien,        r' filter,    5.61" (21pix)

H. Usher, M. Malaric, R. Miles, M. Eleftheriou, C. Stoddard-Jones

F65 Faulkes North    Haleakala, Hawaii                TEL 2.00-m f/10 Ritchey-Chretien,        r' filter,    5.61" (21pix)

R. Miles, A. Debackere, C. Stoddard-Jones, H. Usher, J. Vannini, M. Malaric,

E. Simpson, V. Matei, M. Beer. M. Eleftheriou, J.M. Pérez (INS Alcarràs),

G40 N. Paul          Slooh, Canary Is., Spain         TEL 0.50-m f/6.8 Corrected Dall-Kirkham, no filter,    5.76" (4pix)

G40 N. Evetts

G40 N. Paul          Slooh, Canary Is., Spain         TEL 0.43-m f/6.8 Corrected Dall-Kirkham, no filter,    5.08" (4pix)

H06 iTelescope T11   Mayhill, New Mexico, USA         TEL 0.50-m f/6.8 Corrected Dall-Kirkham, no filter,    4.92" (6pix)

N. James, M. Mobberley

H06 iTelescope T19   Mayhill, New Mexico, USA         TEL 0.43-m f/6.8 Corrected Dall-Kirkham, Red filter,   5.08" (4pix)

E. Herman

H06 iTelescope T21   Mayhill, New Mexico, USA         TEL 0.43-m f/4.5 Corrected Dall-Kirkham, R filter,     5.73" (3pix)

M. Mobberley

H06 iTelescope T21   Mayhill, New Mexico, USA         TEL 0.43-m f/4.5 Corrected Dall-Kirkham, R filter,     5.76" (6pix)

A. Watkins

I64 A. Jones         Maidenhead Observatory, UK       TEL 0.30-m f/6.3 Schmidt-Cassegrain,     Rc filter,    5.22" (9pix)

I81 D. Buczynski     Portmahomack, Scotland, UK       TEL 0.35-m f/6 Schmidt-Cassegrain,       Rc filter,    5.15" (5pix)

I89 iTelescope T18   Nerpio, Spain                    TEL 0.32-m f/5.3 Corrected Dall-Kirkham, Luminance,    5.52" (12pix)

E. Herman, R. Miles

J01 J.J. Gonzalez    Oviedo, Spain                    TEL 0.20-m f/5.5 Ritchey-Chretien,       TG filter,    5.10" (3pix)

K01 A. Watkins       Bradwell, Essex, UK              TEL 0.36-m f/7.7 Schmidt-Cassegrain,     Rc filter,    5.10" (10 pix)

K91 LCO Dome A       Sutherland, S. Africa            TEL 1.00-m f/8 Ritchey-Chretien,         r filter,     5.45" (14pix)

R. Miles

L27 J.-F. Soulier    Dauban, France                   TEL 0.25-m f/3.5 Newtonian reflector,    no filter,    4.48" (3pix)

M09 P.-J. Dekelver   Oudsbergen, Belgium              TEL 0.30-m f/4 Newtonian reflector,      r' filter,    5.60" (5pix)

Q62 iTelescope T30   Siding Spring, Australia         TEL 0.50-m f/4.5 Corrected Dall-Kirkham, R filter,     4.92" (6pix)

M. Mobberley, R. Miles

Q62 iTelescope T31   Siding Spring, Australia         TEL 0.51-m f/4.4 Corrected Dall-Kirkham, R filter,     5.45" (5pix)

M. Mobberley

Q64 LCO Dome A      Siding Spring, Australia          TEL 1.00-m f/8 Ritchey-Chretien,         r' filter,    5.45" (14pix)

J. Perez

T04 LCO Clamshell #1 Haleakala, Hawaii, USA           TEL 0.40-m f/8 Schmidt-Cassegrain,       r' filter,    5.70" (10pix)

U69 iTelescope T24   Auberry, California, USA         TEL 0.61-m f/6.5 reflector               V filter,     5.04" (8pix)

M. Mobberley

U94 iTelescope T5    Beryl Junction, Utah, USA        TEL 0.25-m f/3.4 Reflector,              Luminance,    13.3" (8pix)

R. Miles

U94 iTelescope T11   Beryl Junction, Utah, USA        TEL 0.50-m f/4.5 Reflector,              Luminance,    4.92" (6pix)

P. Manteca

U94 iTelescope T21   Beryl Junction, Utah, USA        TEL 0.43-m f/4.5 Reflector,              R filter,     4.80″ (5pix)

A. Watkins

V37 LCO Dome A      McDonald Observatory, Texas, USA  TEL 1.00-m f/8 Ritchey-Chretien,         r' filter,    5.45" (14pix)

H. Usher (Comet Chasers), J. Vannini, A. Debackere, W. Cuppens, C. Stoddard-Jones

V38 LCO Aqawan-01    McDonald Observatory, Texas, USA TEL 0.40-m f/8 Schmidt-Cassegrain,       r' filter,    5.70" (10pix)

V39 LCO Dome B      McDonald Observatory, Texas, USA  TEL 1.00-m f/8 Ritchey-Chretien,         r' filter,    5.45" (14pix)

H. Usher (Comet Chasers), W. Cuppens, A. Debackere, J. Valldemossa, M. Eleftheriou,

W86 LCO Aqawan A     Cerro Tololo, Chile              TEL 0.40-m f/8 Schmidt-Cassegrain,       r' filter,    5.70" (10pix)

R. Miles, M. Eleftheriou, H. Usher (Comet Chasers), A. Debackere, B. Wooding

W87 LCO Aqawan A     Cerro Tololo, Chile              TEL 0.40-m f/8 Schmidt-Cassegrain,       r' filter,    5.70" (10pix)

B. Wooding

W88 N. Paul          Slooh, La Dehesa, Chile          TEL 0.43-m f/6.8 Corrected Dall-Kirkham, no filter,    5.08" (4pix)

W89 LCO Aqawan B     Cerro Tololo, Chile              TEL 0.40-m f/8 Schmidt-Cassegrain,       r' filter,    5.70" (10pix)

X07 iTelescope T71   Deep Sky Chile, Chile            TEL 0.18-m f/2.8 Reflector,              no filter,    6.20" (4pix)

R. Miles

X07 iTelescope T72   Deep Sky Chile, Chile            TEL 0.51-m f/6.7 Reflector,              R filter,     5.40" (15pix)

E. Herman, R. Miles, A. Watkins

Y98 T. Haymes        Steeple Aston, Oxfordshire, UK   TEL 0.28-m f/5.8 Schmidt-Cassegrain,     no filter,    5.25" (7pix)

Z09 W. Hawley      Fiddington, Somerset, UK       TEL 0.25-m f/10 Schmidt-Cassegrain       r' filter,    5.11" (7pix)

Z10 P. Carson        Fregenal de la Sierra, Spain     TEL 0.32-m f/8 Reflector,                no filter,    5.49" (9pix)

Z17 LCO Aqawan A#2   Tenerife, Spain                  TEL 0.40-m f/8 Schmidt-Cassegrain,       r' filter,    5.70" (10pix)

J. Vannini

Z21 LCO Aqawan A#1   Tenerife, Spain                  TEL 0.40-m f/8 Schmidt-Cassegrain,       r' filter,    5.70" (10pix)

J. Vannini

Z24 LCO Dome B       Tenerife, Spain                  TEL 1.00-m f/8 Ritchey-Chretien,         r' filter,    5.45" (14pix)

R. Miles, A. Debackere, M. Eleftheriou, J.M.Pérez

Z28 N. Paul          Nerpio, Spain                    TEL 0.5-m f/6.8 Corrected Dall-Kirkham,  no filter,    5.40" (10pix)

Z30 D. Storey        Isle of Man, UK                  TEL 0.35-m f/10 Schmidt-Cassegrain,      Rc filter,    5.44" (8pix)

Z31 LCO Dome A       Tenerife, Spain                  TEL 1.00-m f/8 Ritchey-Chretien,         r' filter,    5.45" (14pix)

J. Vannini, M. Malaric, A. Debackere, R. Miles, M. Eleftheriou, B. Wooding + St Marys

Z80 D. Bamberger     England                          TEL 0.25-m f/8 Ritchey-Chretien,         no filter,    4.50" (4pix)

G. Wells

XXX M. Dawson        Calibria, Italy                  TEL 0.51-m f/3.5 Newtonian reflector,    no filter,    5.94" (3pix)

XXX E. Demencik      Slovakia                         TEL 0.46-m f/4.2 Reflector,              no filter,    5.25" (15pix)

XXX T. Haymes        Steeple Aston, Oxfordshire, UK   TEL 0.28-m f/5.8 Schmidt-Cassegrain,     no filter,    5.25" (7pix)

XXX R. Sargent       Chester, UK                      TEL 0.35-m f/7 Schmidt-Cassegrain,       no filter,    5.00" (6pix)

XXX P. Tickner       Lower Earley, UK                 TEL 0.36-m f/9.5 Schmidt-Cassegrain,     R channel     5.76" (8pix)
| The British Astronomical Association supports amateur astronomers around the UK and the rest of the world. Find out more about the BAA or join us. |